Retail footfall analytics in India in 2026 goes far beyond the door counter at your store entrance. Real retail footfall analytics uses AI video analytics on existing store CCTV to track customer paths inside the floor, measure dwell time by display zone, detect queue depth at the checkout in real time, and map which areas convert and which kill the sale — all without adding a single new camera. This guide covers every capability you should demand from a retail footfall analytics platform, how to evaluate vendors without being sold a dashboard, and the three ROI lines that make the conversation with your CFO straightforward.
| 45% Conversion Uplift | <10 Days Go-Live on Existing CCTV | 200+ Pre-Trained Retail AI Models | Zero New Cameras Required |
Why 2026 Is the Year Retail Footfall Data Finally Gets Actionable in India
Indian retail chains have collected footfall numbers for two decades. The gate counter at the entrance. The weekly traffic report from head office. The quarterly summary that arrives well after the merchandising window has closed. None of it explained what happened between the entrance and the till — which display drove a 12-minute dwell, which aisle killed the conversion, why zone 3 gets traffic that never buys.
Three things make 2026 different. AI video analytics platforms now run on the IP CCTV already inside most Indian retail stores — no new cameras, no server rooms, no rip-and-replace. Edge AI processing means the data is real-time, not a 48-hour export. And the economics of Indian retail have shifted: with same-store growth harder than ever to achieve, the conversion rate inside the four walls of a store is the single highest-leverage metric a retail operations head can move. AI video analytics for retail stores is what turns that metric from a lagging indicator into a live lever.
India’s organised retail sector is growing at 20–25% year-on-year (IBEF Retail 2026), but same-store conversion rates have stagnated across mid-size chains. The gap is not footfall volume — it is footfall intelligence. Retail chains that measure what happens inside the store, not just how many people enter it, are compounding same-store sales while competitors attribute flat performance to market conditions.
What Retail Footfall Analytics Actually Does Beyond the Door Counter
A basic footfall counter tells you how many people entered your store. A real retail footfall analytics platform tells you what those people did after they walked through the door — and specifically, what made them buy or leave empty-handed.
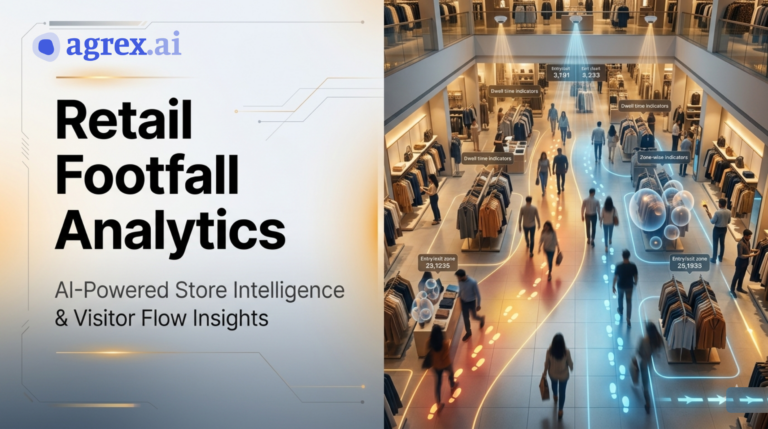
The AI video analytics layer sits between the cameras already mounted in your store and the ops team running the floor. Computer vision tracks movement paths, detects dwell in specific zones, measures queue depth at the checkout, identifies staff-to-customer interaction patterns, and correlates all of that with the transaction log from your POS. The output is not a headcount — it is a live conversion map of your store floor. For the broader architecture behind this, see our full guide to retail video analytics in India.
6 Things Real Retail Footfall Analytics Tracks That a Basic Door Counter Cannot
Use this as your vendor filter. If a platform cannot demonstrate all six on a live store feed — not a recorded demo clip — it is selling a dashboard, not retail footfall analytics.
Capability 1 — Customer Path and In-Store Journey Mapping
Real retail footfall analytics anonymously tracks individual customer paths from entry to exit — not just zone-level heatmaps, but sequential journey patterns. You see which zones customers visit first, which they skip, and which path correlates with a completed transaction. A store manager who can see that customers who visit zone 3 before the checkout convert at 2× the rate of those who don’t has a merchandising brief, not a traffic chart.
Capability 2 — Zone Dwell Time and Conversion Rate by Display
Dwell time is the leading indicator of conversion. Retail footfall analytics measures average dwell per zone, per hour, per day of week — and correlates it with POS data to show which displays drive transactions and which drive browsing without a sale. An end-cap that gets 8-minute average dwell but 4% conversion tells you the product is interesting but the offer is wrong. That is a category manager’s actionable brief, surfaced from camera data already in the store.
Capability 3 — Real-Time Queue Depth and Checkout Wait Detection
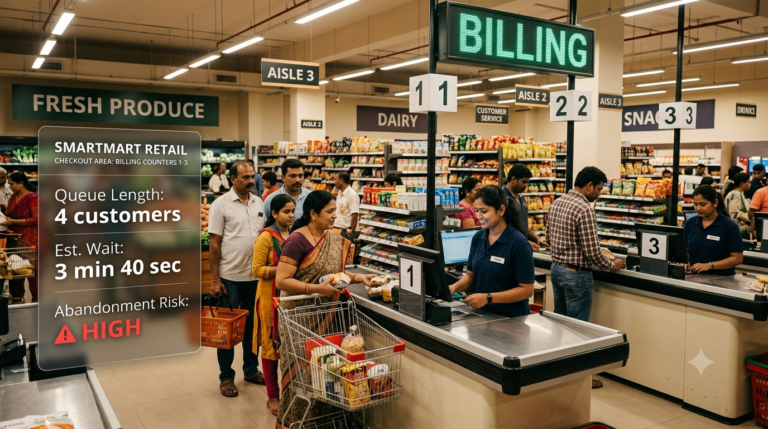
Queue abandonment is a silent revenue killer in Indian retail. A customer who joins a 6-person queue and walks out without buying rarely appears in your data — there is no transaction to count. Real retail footfall analytics tracks queue length at every checkout point second-by-second and pushes a WhatsApp alert to the floor manager the moment the queue crosses your SLA threshold. Opening a second checkout in real time — not three minutes after the customer left — is what captures that revenue.
Capability 4 — Hot Zones, Cold Zones, and Layout Dead Ends
Every store has zones that consistently underperform relative to their rent allocation. Basic retail footfall analytics shows which sections get traffic. Advanced platforms show which zones receive traffic that does not penetrate further — dead ends where the customer path terminates and reverses without a transaction. Identifying a dead-end zone at the back of the store that accounts for 18% of floor space but 3% of conversions is a planogram brief that pays back in the same quarter it is acted on.
Capability 5 — Staff-to-Customer Interaction in Conversion Zones
Retail footfall analytics with staff tracking correlates staff presence in high-dwell zones with conversion outcomes. If your highest-dwell zone converts at 12% when a staff member is present and 4% when one is not, you have a staff deployment brief — not a mystery. The best Indian retail chains are moving staff out of the stockroom and into the conversion zone during peak dwell hours, with measurable same-day revenue impact that shows up in the shift-end report.
Capability 6 — Multi-Store Benchmarking and Peak-Hour Pattern Analysis
A retail footfall analytics platform covering multiple stores produces a benchmarking layer that single-store tools cannot — which store converts peak-hour footfall most efficiently, which layout pattern drives the highest basket size per visitor, which outlet haemorrhages customers at the checkout on Saturday afternoons. Indian retail chains operating 15+ stores use this cross-store intelligence to replicate what works and eliminate what does not, systematically, across the entire estate.

Basic Footfall Counter vs AIVIS Retail Footfall Analytics — Side by Side
The gap between a door counter and a real retail footfall analytics platform is not incremental. It is the difference between knowing your store was busy and understanding why conversion dropped 18% on Saturday afternoon despite normal traffic.
| Dimension | Basic Footfall Counter | AIVIS Retail Footfall Analytics |
|---|---|---|
| Customer path inside store | No | Yes — sequential journey per visitor |
| Zone dwell time by display | No | Yes — per zone, per hour |
| Conversion zone identification | No | Yes — POS-correlated |
| Real-time queue depth | No | Yes — WhatsApp alert on SLA breach |
| Staff presence in conversion zones | No | Yes — shift-level correlation |
| Multi-store benchmarking | No | Yes — one dashboard, all stores |
| Hardware required | Dedicated counter device | Existing IP CCTV cameras |
| Reporting cadence | Daily or weekly export | Real-time alerts + shift-end summary |
The retail chain that knows which display drove a 12-minute dwell is not luckier than its competitor. It has a camera layer that tells it what happened between the entrance and the till — and acts on that data before the day ends.
Customer Intelligence & Retail Operations Insight · Agrex.ai Field Notes 2026
The ROI Math Behind Retail Footfall Analytics — Three Lines Your CFO Will Recognise
Most ROI cases for retail footfall analytics lead with conversion rate lift. That is the right starting point, but it is not the complete picture. Three lines on the CFO version of this conversation have documented outcomes from Indian retail deployments — and each one compounds on the others.
The first line is conversion rate recovery from queue abandonment. Agrex.ai’s Indian retail case study documents a 45% conversion uplift after real-time queue management was deployed on existing store CCTV. The mechanism: customers who would have abandoned a long queue were retained when a second checkout opened within 90 seconds of the queue crossing threshold. See the 45% conversion boost case study for the full methodology. On a store turning ₹2 crore per month, that conversion lift across lost-queue customers is a significant same-store revenue line — not a rounding error.
The second line is zone revenue optimisation from layout intelligence. When retail footfall analytics identifies a dead-end zone consuming 15% of floor space at 3% conversion, and that zone is restructured as a guided path toward the checkout, the revenue-per-square-foot impact compounds across every trading day in the year. Indian retail chains operating 5,000–15,000 sq ft stores find that a single zone reoptimisation — backed by camera-derived journey data — pays back the annual cost of the retail footfall analytics platform within the first quarter of deployment.
The third line is staff deployment efficiency. The hours a store manager spends watching the floor to decide where to place staff are hours not spent on customer engagement or coaching. Retail footfall analytics with staff-in-zone tracking removes that guesswork: the system shows which zone needs a staff presence at which hour, based on dwell-to-conversion data from the last 30 days. Most Indian retail deployments recover 10–14 hours per store manager per week — and same-store basket size data begins moving within 6–8 weeks. For context on loss prevention as the third revenue protection layer, see our retail video analytics India shrinkage guide.
How to Evaluate Retail Footfall Analytics Vendors in India — A 4-Step Filter
A shortlist process that survives the procurement committee and IT security review:
- Journey-first, not headcount-first. Ask the vendor: “Show me a customer path heatmap on a live store feed — not a recorded demo.” A platform that can only show zone-level traffic density is a door counter with a nicer interface, not retail footfall analytics. Real journey mapping requires sequential path tracking, not aggregate zone counts.
- Run the PoC on your existing camera estate. Any vendor who requires a hardware refresh as “phase 0” is building a custom integration, not deploying a platform. Your existing Hikvision, Dahua, CP Plus, or Axis cameras should be fully sufficient for day one. If they are not, the platform is not production-ready for Indian retail scale.
- Validate the POS integration path in the PoC, not after signing. Retail footfall analytics without POS correlation is traffic data without revenue context. Ask for the exact integration method — API, file export, or direct DB connection — and confirm it works with your specific POS in the pilot, before the contract is signed.
- Price the 10th store, not the first. Real retail footfall analytics platforms price the rollout. Ask for the per-store cost at stores 1, 5, and 10. Platforms that require custom integration per site collapse economically past store 5. Edge AI platforms with templated architectures replicate at near-zero marginal cost per additional outlet.
Before committing to any retail footfall analytics vendor, run a 30-day PoC on your single highest-traffic store. Measure queue abandonment rate and zone conversion rate before and after alerts go live. If the vendor cannot show a measurable delta within 30 days on a live feed, the platform is not ready for your operation. Among the broader video analytics companies in India, the ones with production-grade retail deployments will welcome this test — the ones without will find reasons to delay it.
Why Indian Retail Chains Standardise on Agrex.ai AIVIS for Retail Footfall Analytics
AIVIS — Agrex.ai’s agentic AI video analytics platform — is built around the six capabilities above. It runs at the edge on existing retail CCTV, ships with 200+ pre-trained retail AI models covering customer journey, zone dwell, queue depth, staff interaction, and loss prevention, and produces shift-level and cross-store intelligence without a cloud egress requirement or VLAN change.
It is the same platform that produced the 45% conversion uplift in Agrex.ai’s retail case study, and the same edge architecture that powers deployments across retail video analytics, QSR operations, logistics, and manufacturing clients across India. A retail chain that adds a warehouse or a company-owned restaurant brand does not need a second platform — one edge AI stack, one dashboard, one audit trail across the entire operation.
For Indian retail chains evaluating a retail footfall analytics platform that is hardware-agnostic, deploys in under 10 days, and produces real-time queue and journey intelligence from day one — AIVIS is the starting conversation. Among the top video analytics companies in India, it is the only one purpose-built for the specific operational challenges of Indian multi-store retail.
Frequently Asked Questions About Retail Footfall Analytics
What is retail footfall analytics?
Retail footfall analytics is the measurement and analysis of customer movement inside a retail store — not just how many people enter, but where they walk, how long they spend per zone, which displays they interact with, how long they queue at the checkout, and which paths correlate with completed transactions. In 2026, the best retail footfall analytics platforms use AI video analytics on existing store CCTV to produce this data in real time, without any additional hardware.
How is retail footfall analytics different from a basic door counter?
A basic door counter measures entries and exits — headcount only. Retail footfall analytics measures what happens inside the store: customer paths, zone dwell times, queue depth at the checkout, staff interaction in conversion zones, and cross-store benchmarking. The difference is the difference between knowing your store was busy and knowing why conversion dropped 18% on Saturday afternoon despite normal footfall volume.
Do I need new cameras to deploy retail footfall analytics?
No. Production-grade retail footfall analytics platforms in India — including Agrex.ai’s AIVIS — are hardware-agnostic. They deploy on the IP cameras already in your store via RTSP/ONVIF, which covers virtually every Hikvision, Dahua, CP Plus, or Axis camera installed in Indian retail over the last decade. Analogue cameras on a DVR can be bridged with a low-cost encoder. Any vendor requiring a full camera replacement as a deployment prerequisite is not operating a productised platform.
How long does retail footfall analytics take to deploy in an Indian store?
With an edge AI platform on existing CCTV, a single-store go-live takes under 10 days: day 1–3 for site survey and camera mapping, day 4–7 for alert configuration and staff briefing. Stores 2 through 5 replicate from the same templated architecture in 3–5 days each. Any retail footfall analytics vendor quoting 60+ days for a first store is building custom infrastructure, not deploying a platform.
How does retail footfall analytics increase conversion rate?
Retail footfall analytics increases conversion through three mechanisms. Real-time queue management captures customers who would have abandoned a long checkout queue — the floor manager gets a WhatsApp alert when the queue crosses threshold and opens a second checkout before the customer walks out. Zone intelligence identifies which displays drive dwell-to-purchase and which drive browsing without a sale, enabling targeted planogram changes. Staff deployment data places associates in the zones where their presence statistically increases basket size. Agrex.ai’s retail case study documents a 45% conversion uplift across these mechanisms on Indian store deployments.
What is the best retail footfall analytics platform for Indian stores in 2026?
The best retail footfall analytics platform for Indian stores in 2026 runs on existing CCTV without hardware replacement, produces real-time queue and journey intelligence (not just daily reports), integrates with your POS for conversion correlation, and scales across multiple stores without custom per-site integrations. Agrex.ai’s AIVIS meets all four criteria with documented Indian retail deployments, 200+ pre-trained retail models, and go-live in under 10 days per store.
How does retail footfall analytics integrate with POS systems?
Retail footfall analytics platforms integrate with POS systems via API, file-based export (CSV/JSON), or direct database connection depending on the POS in use. The integration allows the AI layer to correlate customer path and dwell data with transaction records — telling you not just that 340 customers visited zone 4 today, but that 87 completed a transaction and 253 did not, and the specific journey patterns that distinguished the two groups. Most Indian retail POS systems — SAP Retail, Oracle MICROS, and proprietary chain platforms — have supported integration paths.
Is retail footfall analytics compliant with India’s DPDP Act?
Yes, when deployed on an edge AI architecture. Agrex.ai’s AIVIS processes video locally on an on-site edge box — no raw video is sent to cloud servers or third parties. The platform runs in anonymised analytics mode by default: customer paths and dwell data are tracked as aggregate spatial patterns without facial recognition or biometric identification. This architecture is compliant with the Digital Personal Data Protection Act 2023, and the data residency model — all processing on-premise, only metadata synced to the dashboard — satisfies most Indian enterprise data governance requirements.
See What Your Existing Store CCTV Already Knows About Your Customers
Agrex.ai AIVIS deploys retail footfall analytics on your existing cameras in under 10 days. Real-time queue alerts, customer journey maps, zone conversion data — zero new hardware, zero VLAN changes, live from day one.
Book a Free Demo →