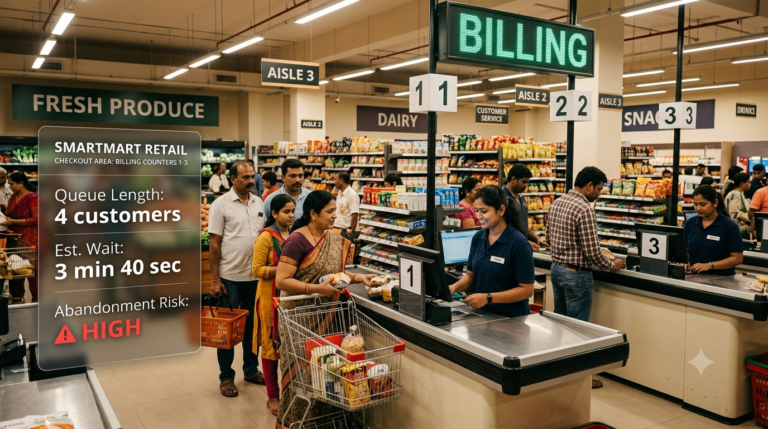
Every minute a customer waits in your checkout queue, your retail queue management system — or the absence of one — is costing you money. Your store had 500 visitors on Saturday. Your POS shows 87 transactions. Most retail managers would call that a normal weekend. It is not normal — it is a revenue leak. Across a 20-store chain, the gap between footfall and actual sales compounds into ₹40–60 crore in preventable lost revenue every year. The dangerous part: most of it happens in the last three feet before the counter — during checkout, in the queue, in the moment a customer decides to leave rather than wait.
Retail queue management is the real-time monitoring, measurement, and optimisation of customer queues at checkout counters and service points inside a retail store. An AI-powered retail queue management system uses existing CCTV cameras to track queue length, wait time, and abandonment rate — enabling store managers to act before a customer walks out.
Understanding retail queue management as a discipline requires looking at three data streams simultaneously. Effective retail queue management is just one piece of the problem — and without a dedicated retail queue management system, Heat maps and dwell time are the other two. Together, they form a complete picture of the customer journey inside your store — and your cameras are already capturing all of it. You are simply not reading it yet. This post breaks down the exact math, the exact mechanisms, and the exact data your stores need to stop this leak permanently.
The Only Number That Actually Moves Retail Revenue
Indian retailers are obsessed with footfall. How many people walked in? Did traffic go up this weekend? But footfall is a vanity metric — it does not pay rent, wages, or inventory. Conversion rate is the only lever that directly controls revenue, and it is almost always the most under-measured number in a retail business.
Here is the math that should change how you think about every store you operate:
| Scenario | Daily Visitors | Conversion Rate | Daily Transactions | Avg Ticket (₹) | Annual Revenue/Store |
|---|---|---|---|---|---|
| Current State | 500 | 17% | 85 | 1,500 | ₹4.67 Cr |
| +2% Conversion Lift | 500 | 19% | 95 | 1,500 | ₹5.22 Cr |
| Annual Gain Per Store | — | — | +10 txns/day | — | +₹55 Lakh/Store/Year |
A 2% conversion lift — not a marketing campaign, not a new product launch — adds ₹55 lakh per store per year. Across 10 stores: ₹5.5 crore. Across 50 stores: ₹27.5 crore. That is the scale of the opportunity sitting inside your existing CCTV footage. According to a Capgemini Research study on smart stores, retailers who deploy in-store analytics report an average 4–6% conversion improvement within the first year — more than double the 2% threshold in the table above.
The question is not whether the opportunity exists. It is which three metrics you need to measure — and act on — to unlock it. Read how AI video analytics delivered a 45% conversion boost for a leading footwear chain to see what 2% actually looks like when scaled across 1,800+ stores.
How Your Cameras Already Know Why Shoppers Don’t Buy
Every customer who enters your store follows a journey. They enter, move through zones, engage with products, and either purchase or leave. Each step in that journey has a measurable signal — and every one of those signals is already visible in your existing CCTV footage if you know how to read it.
The three signals are: footfall analytics (where customers go), dwell time (how long they stay and engage), and retail queue management data (what happens at the checkout stage). Measuring all three is what a modern retail queue management solution does. Together, they form the complete customer behaviour analysis framework that separates stores converting at 17% from those converting at 24%.
What most retailers do not realize: fixing conversion does not require redesigning the store. It requires knowing which three or four specific changes — a display moved two meters, a counter opened at 6pm, a staff member repositioned near a high-dwell zone — would eliminate the biggest drop-off points. That is what AI-powered retail video analytics makes visible for the first time.
Heat Maps: The X-Ray Your Store Has Never Seen
A heat map overlays your store’s floor plan with colour-coded traffic density data derived from your cameras. Red zones indicate high traffic. Blue zones are rarely visited. The patterns they reveal are almost always surprising — and almost always expensive.
Consider a scenario documented in Agrex AI’s apparel retail case study: a menswear store placed its highest-margin formal wear collection in the back-right quadrant because the visual merchandising team liked the lighting there. The heat map revealed that fewer than 12% of customers ever reached that zone. Premium SKUs were invisible to 88% of visitors. The fix was not a new campaign — it was moving the display 4 meters closer to the natural customer flow path. Conversion on that category jumped 31% within 30 days.
Heat maps also expose what you cannot see with the naked eye: attention dead zones — areas where customers physically pass through but psychologically disengage. Ceiling height, lighting angles, fixture density, and proximity to exits all affect where shoppers mentally check out before the checkout counter. A heat map shows you precisely where attention dies, so you stop spending on displays that no one actually processes.
The actionable insight is not the map itself. It is the gap between where your highest-margin products sit and where your customer traffic naturally flows. Close that gap, and you have unlocked a conversion lever that no amount of digital advertising can replicate — because this happens entirely inside your four walls, on customers who are already there.
Dwell Time: The Multiplier That Lifts Conversion and Basket Size Simultaneously
Dwell time is the number of seconds a customer spends in a specific store zone. It is not a soft metric. It is the strongest proxy for purchase intent that exists in physical retail — and it drives two separate revenue outcomes at the same time.
Data from Agrex AI deployments across 1,800+ retail stores shows a consistent pattern: customers who spend 30+ seconds in a product zone are 3.2x more likely to purchase something from that zone compared to customers who spend under 10 seconds. But dwell time does not just improve conversion rate. It also increases basket size. A customer who spends 4+ minutes in-store buys an average of 2.4 items. A customer who spends 90 seconds buys 1.1 items. Every additional minute of dwell time is worth approximately ₹300–500 in incremental basket value at a mid-market apparel or footwear store.
This has direct implications for store layout, staff positioning, and category sequencing. If your fitting room zone shows low dwell time, your staff coverage there is probably inadequate — shoppers are not getting assistance at the moment they need it most. If your accessories display shows high dwell but low conversion, the product is drawing attention but not closing — a pricing or assortment problem that no amount of footfall growth will fix.
Most Indian retailers do not measure dwell time at all. They are making ₹10 crore layout decisions — planogram changes, fixture investments, staffing schedules — based on gut instinct and monthly POS reports. That is the equivalent of managing a fleet of 50 stores with the intuition of a single store manager from 2018. The data already exists in your cameras. The only question is whether you are reading it.
Retail Queue Management: Where 23% of Your Sales Walk Out the Door
Everything above — the heat map optimization, the dwell time improvements, the conversion lift — can be completely undone by a five-minute queue at the checkout counter. This is the final and most immediate revenue leak in the store, and it is entirely preventable.
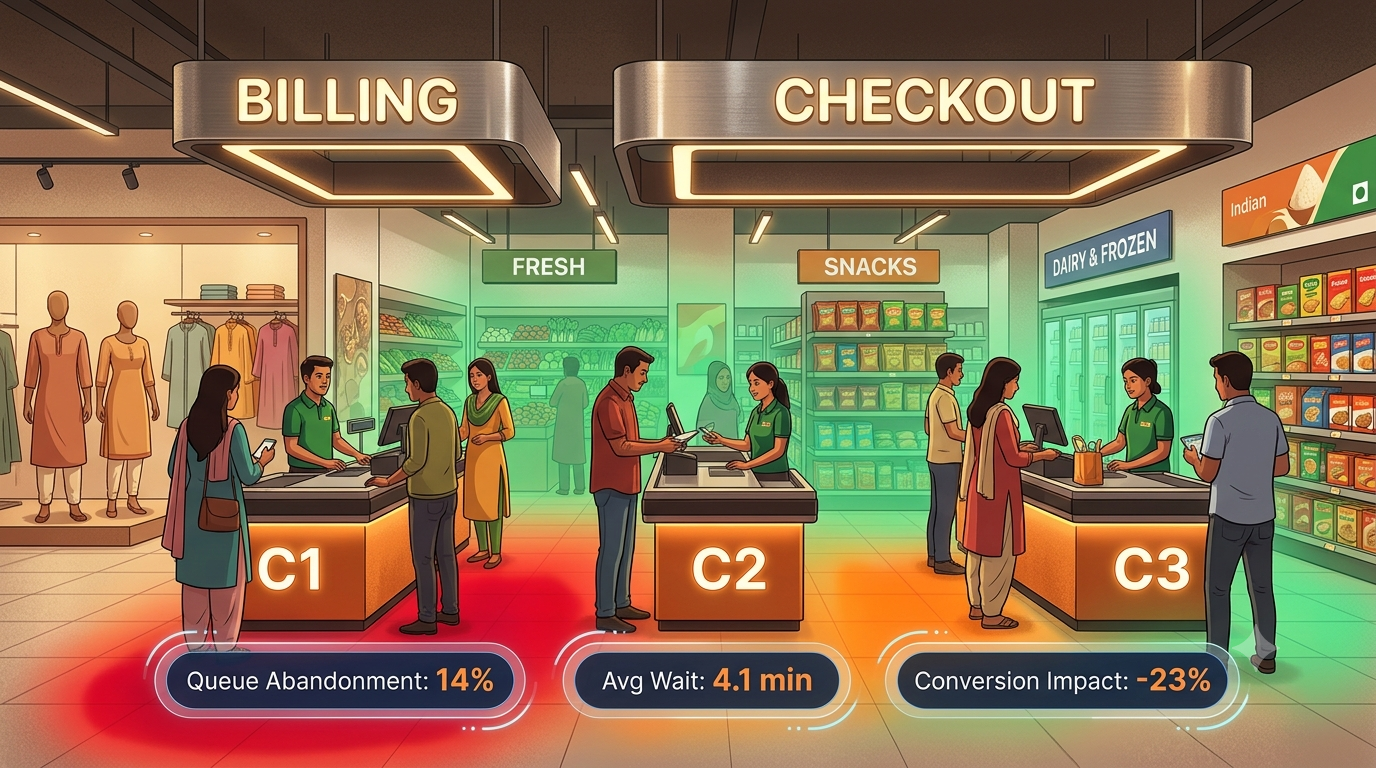
Industry research consistently shows that between 20–25% of customers who have already decided to purchase will abandon their transaction if the queue wait exceeds 4 minutes. These are not browser customers — they are buyers. They have already picked up the product. They have already decided to spend money. But poor retail queue management — specifically, the inability to detect and respond to queue buildup in real time — sends them out empty-handed and unlikely to return.
Here is what that walkaway rate actually costs a single mid-size retail store annually:
| Metric | Value |
|---|---|
| Daily footfall | 500 visitors |
| Customers who reach checkout-intent stage | ~120 (24%) |
| Queue abandonment rate (wait >4 mins) | 23% |
| Abandoned transactions per day | ~28 |
| Average transaction value | ₹1,500 |
| Daily revenue leaked to queue abandonment | ₹42,000 |
| Annual revenue leaked per store | ₹1.53 crore |
| Add heat map and dwell time losses | ~₹1.04 crore |
| Total annual leak per store | ₹2.57 crore |
What makes effective retail queue management fundamentally different from simply hiring more staff is the role of timing and intelligence. You do not need more staff. You need the right staff in the right place at the right moment. AI-powered queue analytics software monitors your checkout cameras continuously, measures queue length and wait time per counter in real time, and alerts your floor manager the moment a queue exceeds your configured threshold — before customers decide to leave.
The manager’s response takes 30 seconds: open a second counter, or redirect a nearby sales associate from a low-traffic zone. That single action, triggered 60 seconds faster than manual observation allows, is worth ₹1.5+ crore in recovered revenue per store per year. This is not hypothetical — it is the baseline result Agrex AI clients see within 180 days of deploying real-time retail queue management monitoring across their locations.
The Decision Dashboard: One Number, One Manager Move
The power of integrated retail queue management analytics lies in simplicity. The challenge with introducing heat maps, dwell time data, and retail queue management analytics — and building a retail queue management culture — simultaneously is that it can feel overwhelming to a store manager already managing staff, handling escalations, and walking the floor every hour.
This is exactly why the Agrex AI platform is built around a single decision dashboard — not a reporting tool, but an action trigger. At any given moment, the dashboard surfaces one priority: Queue at Counter 3 has exceeded 6 customers. Open Counter 4. Or: Dwell time in Zone B dropped 40% versus last Saturday. Check staff coverage there. There is no data interpretation required from the manager. The system does the analysis. The manager executes one move.
This is the principle that makes retail queue management — and the full analytics stack — actually usable at store level, not just at head office. The best analytics platform in the world is worth nothing if store managers cannot act on it within 60 seconds of receiving the signal. The decision dashboard is built precisely for that constraint.
Watch the full customer journey in action — heat maps, dwell time multiplier, real-time queue alerts, and the decision dashboard — in the video below:
See Your Store’s ₹2.57 Crore Revenue Leak — In Real Time
Agrex AI connects to your existing cameras in days — no new hardware required. Heat maps, dwell time, and real-time retail queue management alerts for every store in your chain, on a single dashboard.
Deploying Retail Queue Management Analytics: No New Hardware Required
The most common objection Indian retailers raise when exploring in-store analytics is infrastructure cost. The assumption is that AI analytics requires new cameras, new sensors, or expensive installation projects. It does not.
The Agrex AI retail queue management software connects to your existing IP cameras via standard RTSP and ONVIF protocols — the same protocols used by Hikvision, Dahua, Axis, and every major brand installed in Indian retail stores today. There is no new hardware to procure, no disruption to store operations, and no capital expenditure on hardware or infrastructure. A single store location goes live in 1–2 weeks. For multi-store retailers, phased rollouts typically cover all locations in 8–12 weeks, with configuration templates replicable across similar store formats.
The full analytics stack — heat maps, dwell time, retail queue management alerts, and the decision dashboard — is accessible through a single cloud-based interface for both store managers and regional heads. Multi-store benchmarking, cross-location trend analysis, and centralized SOP compliance monitoring are included from day one. For a complete technical overview, read our complete guide to what is video analytics and how it works across retail environments.
If you manage a chain of 10+ stores and are not yet using a retail queue management system to measure conversion rate, dwell time, and queue abandonment independently — you are running blind. The data is already there. Your cameras recorded every queue, every dead zone, every shopper who walked out rather than waited. The only step remaining is reading it.
Frequently Asked Questions on Retail Queue Management
What is retail queue management in physical retail stores?
Retail queue management is the process of monitoring, measuring, and reducing checkout wait times in a physical store to prevent customer abandonment and revenue loss. AI-powered retail queue management uses computer vision on existing store cameras to measure queue length, average wait time, and service speed per counter in real time — automatically alerting managers before the queue reaches the abandonment threshold. Traditional retail queue management methods rely on staff observation; AI does it 24/7 without human intervention.
How much revenue do Indian retailers lose to checkout queue abandonment?
A single mid-size retail store loses approximately ₹1.53 crore per year to checkout queue abandonment alone — customers who had already selected products but left because the wait exceeded 4 minutes. This is precisely the gap that retail queue management is built to close. Combined with revenue lost to poor product placement and low dwell time, the total revenue leak per store reaches approximately ₹2.57 crore annually. Across a 10-store chain, that is ₹25.7 crore in recoverable revenue. This is documented, quantifiable, and fixable.
How do AI heat maps help improve in-store conversion rates?
AI heat maps in retail are generated by processing camera footage to track customer movement across the store floor plan, colour-coding zones by traffic density. This reveals where customers naturally flow and where attention dead zones exist. By identifying the gap between product placement and customer traffic patterns, retailers can reposition displays to dramatically increase conversion rates — often within 30 days of a layout change. No manual surveys, no guesswork.
What is dwell time in retail and why does it impact revenue?
Dwell time in retail is the number of seconds a customer spends in a specific product zone or display area. It is the most reliable proxy for purchase intent — customers who spend 30+ seconds in a zone are 3.2× more likely to purchase from that zone. Dwell time also directly increases basket size: customers who spend 4+ minutes total in-store buy an average of 2.4 items versus 1.1 items for those who spend 90 seconds. AI-powered dwell time analytics lets retailers identify which zones are converting and which are failing.
Can AI retail queue management work with my existing CCTV cameras?
Yes. The Agrex AI retail queue management software connects to any existing IP camera infrastructure using standard RTSP and ONVIF protocols — compatible with Hikvision, Dahua, Axis, Bosch, and Hanwha. No new hardware is required. Deployment for a single store takes 1–2 weeks. For multi-store chains, full rollout completes within 8–12 weeks. The system is cloud-managed with on-edge processing, so there is no impact on store network bandwidth or POS systems.