Real-Time Shopper Intelligence with AIVIS
Agrex.ai implemented its AI-powered video analytics solution across the pilot supermart locations, focusing on three core computer vision capabilities. The platform transforms existing CCTV cameras into intelligent sensors — no new hardware required. See how another retailer used AIVIS to optimize store operations with similar results.
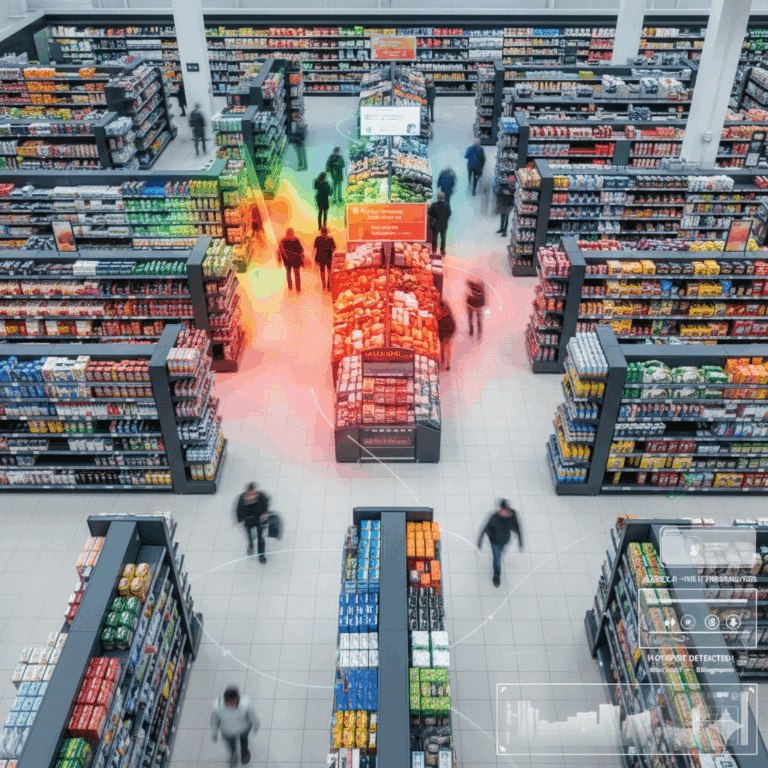
Heatmap & Dwell Time Analysis
AI models process video feeds to generate heatmaps, visually representing hot spots and cold spots. The system calculates zone-wise footfall counts and tracks average dwell time for every section and product category — differentiating between mere pass-by traffic and genuine product engagement. Research from IGD Retail Analysis confirms that data-driven store layout optimization can significantly improve customer conversion and basket size in grocery retail.
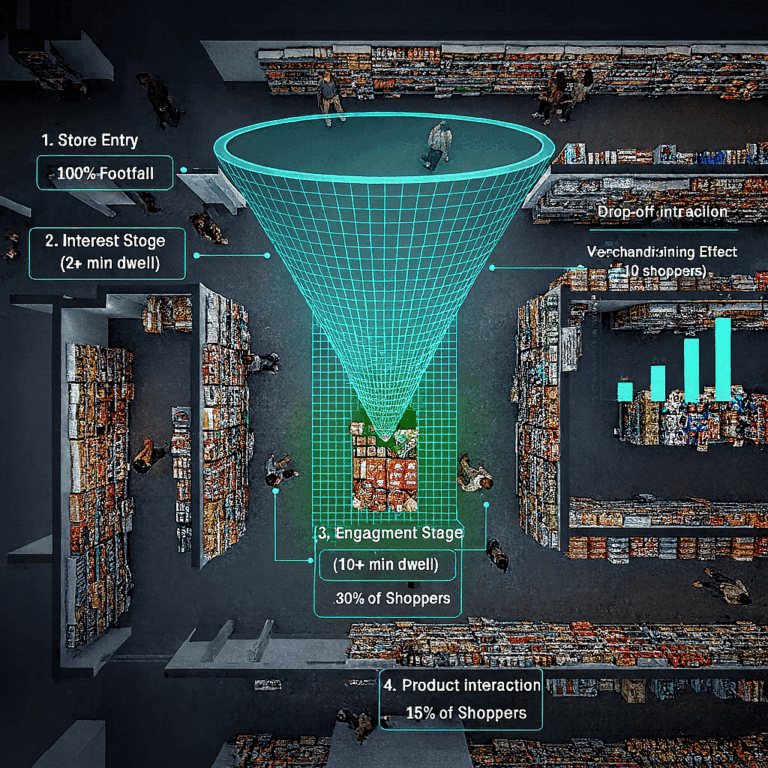
Conversion Funnel Analysis
Defines a multi-stage customer journey funnel within the supermart, tracking anonymized shoppers from store entry through interest (2+ min dwell), engagement (10+ min dwell), and product interaction stages. This precisely quantifies conversion rates for marketing and merchandising efforts, allowing the retailer to optimize product placement based on observed customer attention.
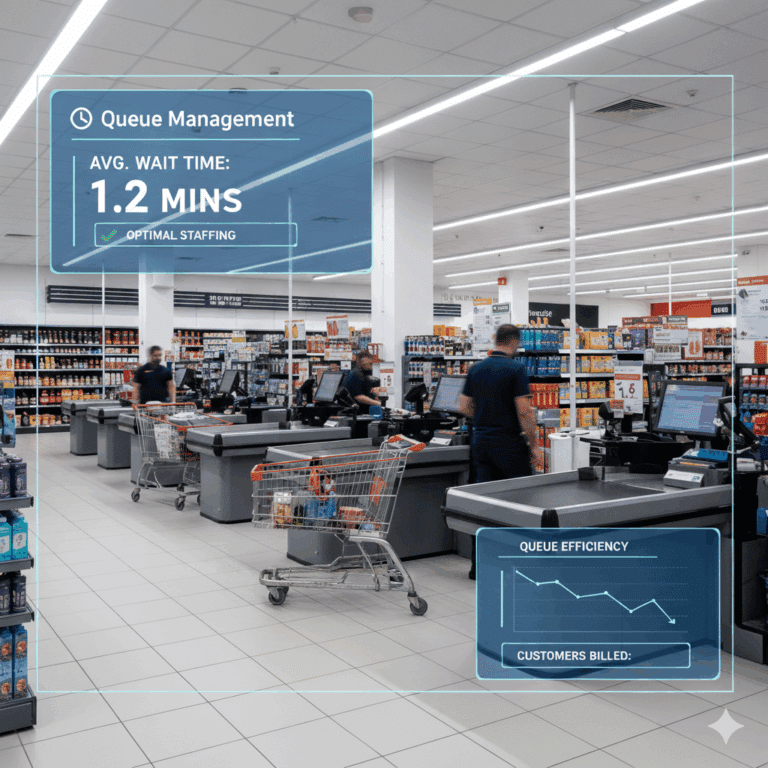
Queue Management & POS Tracking
Monitors the final transaction phase by tracking conversion and efficiency at the Point of Sale — from customers entering the checkout area, to successful billing, to those who abandoned without completing a transaction. Real-time metrics on queue lengths and wait times enable managers to proactively staff checkout lanes and minimize basket abandonment. Want to optimize your supermart? Talk to our team about implementing AIVIS.