Footfall Analytics Software for Retail & Commercial Spaces
AI-powered footfall tracking that measures visitor counts, peak hours, dwell time, and customer flow — helping retailers reduce costs and grow revenue.
Footfall analytics is the AI-powered measurement and analysis of visitor foot traffic in physical spaces. Using cameras and computer vision, it tracks entry counts, peak hours, dwell time, and customer flow patterns — enabling retailers, QSRs, and logistics facilities to optimize staffing, layout, and marketing performance in real time.
Why Footfall Data Is a Competitive Advantage in 2026
Retailers operating without footfall data are making decisions blind. Every hour, visitors enter your store — browsing, waiting, leaving without buying. Footfall analytics transforms this invisible behaviour into structured, actionable data.
Footfall tracking integrates directly with your existing CCTV infrastructure. No new hardware. No disruption. Just intelligence layered on top of what you already have. Pair it with a reliable CCTV monitoring system to ensure your cameras are always online and capturing accurate data.
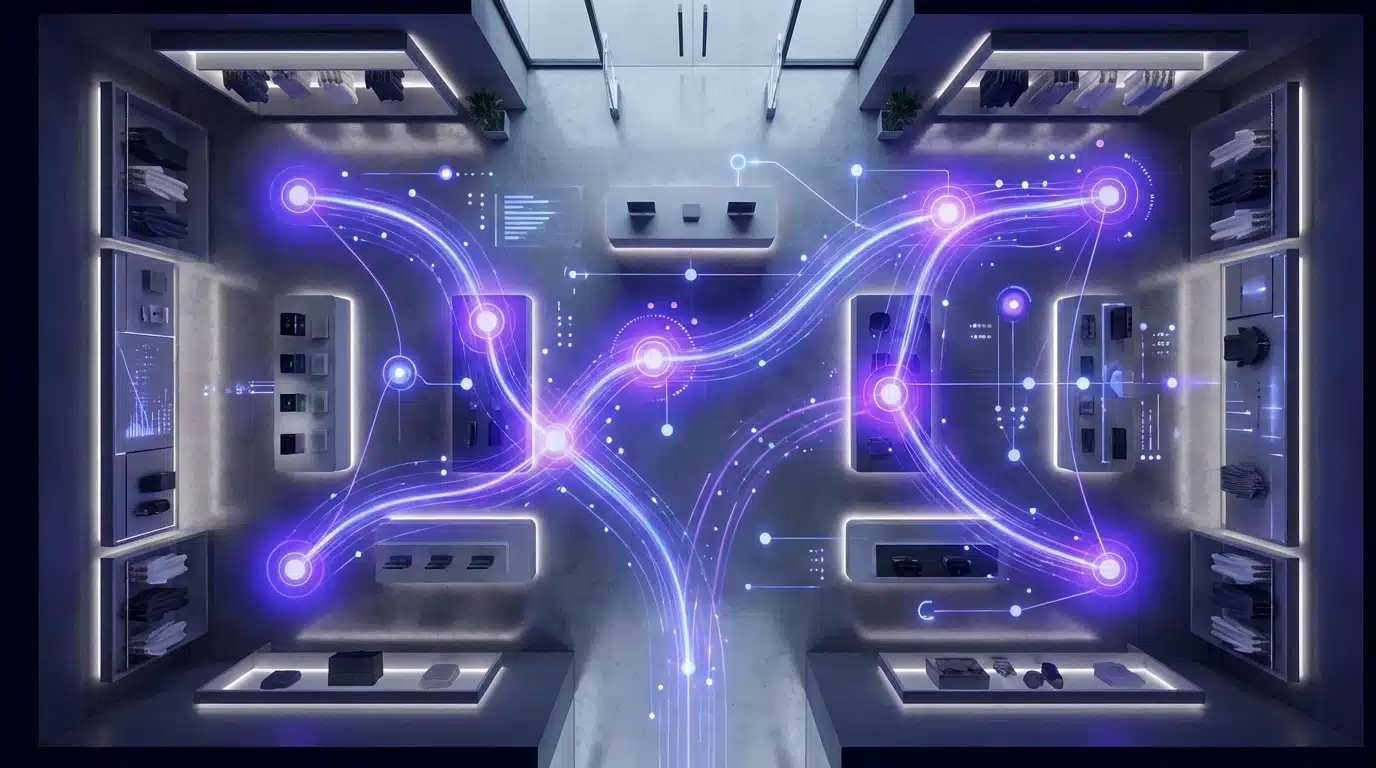
Key Footfall Metrics the AIVIS Platform Tracks
Agrex AI's AIVIS platform captures and reports the following footfall analytics metrics in real time across all connected locations:
How AI-Powered Footfall Tracking Works
Five steps from camera connection to actionable footfall intelligence — no new hardware required.
AIVIS connects to your existing IP cameras or NVR systems — no new hardware required. Supports RTSP, ONVIF, and all major NVR brands including Hikvision, CP Plus, Dahua, and Axis.
Computer vision models detect and count individuals as they enter, move through, and exit your space. Accuracy: 95%+ in standard lighting conditions. Processing happens on-device or via cloud depending on deployment model.
AI tracks dwell time per zone, customer flow paths, queue lengths, and demographic patterns — all in real time. Zone heatmaps reveal exactly where visitors spend time and where they abandon.
Live footfall data is visible on the AIVIS dashboard from any device. Automated alerts trigger for queue thresholds, unusual footfall drops, or peak overloads — delivered via email, WhatsApp, or mobile app.
Automated daily, weekly, and monthly footfall reports with conversion overlays are sent directly to your operations team. Integrates with your existing AI video analytics stack and POS systems.
Footfall Analytics Across Industries
Footfall analytics in retail drives measurable ROI. Track conversion rates by store, identify low-traffic zones for fixture repositioning, and align staff schedules to peak visitor windows.
Queue analytics and peak-hour footfall tracking help QSR operators reduce wait times and improve throughput. Real-time alerts when queue depth exceeds defined thresholds — preventing customer abandonment.
People movement analytics for loading docks, entry gates, and restricted zones. Footfall data supports compliance, shift productivity analysis, and facility utilisation reporting.
AI Footfall Analytics vs Traditional People Counters
| Feature | Traditional Counter | Agrex AI Footfall Analytics |
|---|---|---|
| Technology | Infrared beam / pressure mat | Computer vision + deep learning |
| Accuracy | 70–80% | 95%+ |
| Metrics tracked | Entry count only | Count + dwell + demographics + zones + queues |
| Hardware required | Dedicated sensor units | Existing CCTV cameras |
| Real-time alerts | No | Yes |
| Reporting | Weekly manual exports | Live dashboard + automated daily reports |
| ROI visibility | Not possible | Conversion rate overlay included |
| Setup time | 2–4 weeks | 48–72 hours |
Footfall Analytics Results from Agrex AI Deployments
Data from live deployments across retail and QSR clients in India, 2024–2026
All figures are based on Agrex AI live deployment data from retail and QSR clients in India. Individual results may vary by store format and baseline operations.
Meet AIVIS — Agrex AI Footfall Intelligence Platform
AIVIS is Agrex AI enterprise video analytics platform, purpose-built for physical spaces in retail, QSR, banking, logistics, and manufacturing. It runs on your existing camera infrastructure and delivers real-time footfall intelligence through a single dashboard accessible from any device.
Footfall Analytics — Frequently Asked Questions
What is footfall analytics?
Footfall analytics is the process of measuring and analysing visitor foot traffic in physical spaces using AI-powered cameras and computer vision. It captures data on entry counts, dwell time, peak hours, zone heatmaps, and customer demographics — enabling businesses to make data-driven decisions about staffing, layout, and marketing.
How does footfall tracking work without additional hardware?
Agrex AI's AIVIS platform integrates with existing IP cameras and NVR systems already installed in your facility. Computer vision models are applied to the live camera feed, detecting and tracking individuals without requiring any new sensors or cameras. Setup typically takes 48–72 hours.
What metrics does footfall analytics measure?
Key metrics include: total visitor entry and exit counts, hourly and daily traffic patterns, dwell time per zone, queue wait times, conversion rate (footfall vs. transactions), demographic segmentation (age, gender), and repeat visitor rate. All metrics are available in real time on the AIVIS dashboard.
How does footfall data help increase retail sales?
Footfall data reveals when customers visit, where they browse, and when they leave without buying. Retailers use this to align staffing with peak traffic, redesign low-conversion zones, reduce queue abandonment, and run targeted in-store promotions at high-traffic windows. Agrex AI deployments have recorded conversion improvements of 15–30% within 90 days.
What is the difference between footfall analytics and people counting?
People counting measures only how many people enter a space. Footfall analytics goes further — it tracks where customers go, how long they stay, what queues form, and which demographics visit. Agrex AI's footfall analytics includes conversion overlays, zone heatmaps, and real-time alerts, making it a full visitor intelligence platform rather than a simple counter.
Start Tracking Footfall Intelligence Today
Join retailers, QSR chains, and enterprises across India using Agrex AI to turn visitor data into revenue.