QUICK ANSWER
Footfall analytics is the measurement of customer movement inside a retail store using AI-powered cameras – tracking how many people enter, which zones they visit, how long they stay, and whether they buy. In India, leading retail chains use footfall analytics to measure gender distribution, zone-specific dwell time, queue wait times, and dwell-to-purchase conversion ratios in real time.
Agrex AI’s AIVIS platform runs footfall analytics on existing CCTV cameras without hardware changes. Retailers using Agrex AI have recorded a +17% increase in conversion rates, +14% higher footfall, and a -26% reduction in queue wait times within 11 weeks. Footfall tracking works across department stores, fashion chains, electronics retail, supermarkets, and QSR outlets. All data is anonymized – no facial recognition, no personal data stored.
TABLE OF CONTENTS
- What Is Footfall Analytics?
- How AI-Powered Footfall Analytics Works
- 6 Key Footfall Metrics for Indian Retail
- 6 Use Cases of Footfall Analytics in Indian Retail
- Footfall Analytics Technologies Compared
- Real Results: Indian Retail Chains Using Footfall Analytics
- Footfall Analytics for Different Retail Formats
- How to Choose a Footfall Analytics Platform
- ROI and Business Impact
- Frequently Asked Questions
- Conclusion
What Is Footfall Analytics?
Footfall analytics is the practice of counting, tracking, and analyzing the movement of customers through a physical retail space using AI-powered cameras. At its core, footfall analytics answers the question every retail manager needs answered: how many customers visited my store, what did they do inside, and how many of them bought something?
Indian retailers have counted customers manually for decades. What changed is the depth of intelligence now available. Modern footfall analytics platforms powered by deep learning track individual customer journeys through every zone, measure dwell time at fixture level, identify demographic patterns, detect queue build-up in real time, and correlate all of this with POS transaction data – from the CCTV cameras already installed in the store.
According to the National Retail Federation, over 73% of top-performing retailers now use AI-powered footfall tracking as a primary operational metric. In India, the adoption curve is accelerating faster than any other retail market in Asia.
KEY INSIGHT
Indian retail’s conversion problem is not a footfall problem. Average Indian high-street stores convert 12-18% of visitors into buyers. The same stores using AI-powered footfall analytics with zone-level dwell data and real-time queue alerts consistently reach 20-28% conversion within two quarters of deployment.
How AI-Powered Footfall Analytics Works
AI footfall analytics uses deep learning models trained on millions of retail images to detect, track, and analyze people across your existing CCTV cameras. The process runs in four real-time stages, entirely on-premise without sending footage to the cloud.
Stage 1: Person Detection
Neural networks identify every person in each video frame with 95-98% accuracy even in crowded environments, poor lighting, or partial occlusion. Agrex AI’s AIVIS models are trained on Indian retail environments, handling the density and movement patterns of Indian shoppers.
Stage 2: Multi-Object Tracking
Each detected person receives a unique anonymous ID that persists across frames and camera zones. The system tracks individual customer journeys from entrance through each store department to checkout – without storing any personal identification data. This is the foundation of zone-level footfall analysis.
Stage 3: Zone and Line Analytics
Virtual counting lines at all entrances and exits register direction-specific traffic. Zone boundaries defined in software overlay the camera feeds – each fitting room, each department, each end-cap becomes a measurable area with its own dwell time, traffic count, and conversion contribution.
Stage 4: Real-Time Dashboards and Alerts
Aggregated data flows to dashboards for store managers, regional merchandisers, and head office teams. Queue wait time alerts fire via WhatsApp or SMS when queues exceed thresholds. Weekly retail footfall data reports compare store-by-store performance and feed into staff scheduling models.
6 Key Footfall Metrics for Indian Retail
Raw traffic counts are the starting point. The real value of footfall analytics comes from the six metrics that connect traffic to revenue performance.
| Metric | What It Measures | Why It Matters |
|---|---|---|
| Zone-Specific Footfall | Traffic count by store section | Identifies dead zones and high-traffic areas for layout optimization |
| Dwell Time | Average time per zone | Longer dwell correlates directly with purchase probability |
| Queue Wait Time | Real-time queue length at checkout | Each 1-min reduction in wait time increases conversion ~3% |
| Dwell-to-Purchase Ratio | % of zone visitors who buy | The true conversion KPI – beyond simple headcount |
| Gender Distribution | Anonymized demographic mix | Drives product placement and staff training by zone |
| Peak Hour Profile | Hourly traffic by day | Optimizes staff scheduling and promotion timing |
6 Use Cases of Footfall Analytics in Indian Retail
Footfall analytics delivers measurable outcomes across six operational areas that directly impact revenue and profitability for Indian retail chains.
1. Store Layout Optimization
Heatmaps from footfall tracking data reveal which zones attract customer attention and which are dead spots. Merchandisers use weekly heatmap reports to reposition high-margin categories into high-traffic paths and place promotional displays where customers naturally pause. One Agrex retail customer moved three category sections based on footfall analysis data and saw a 14% lift in sales from those categories within 30 days.
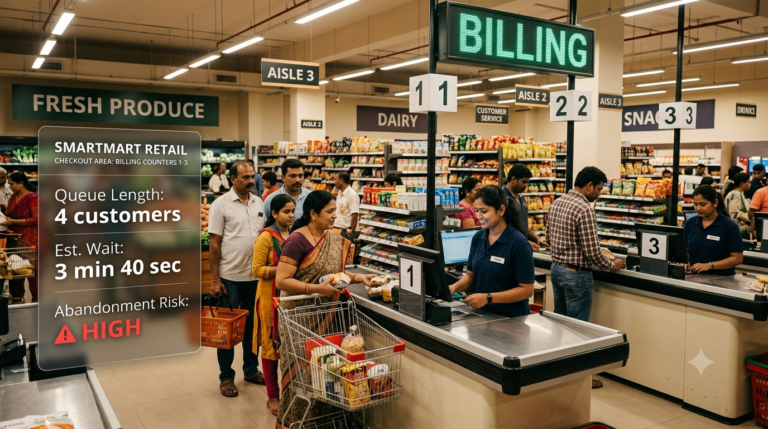
2. Real-Time Queue Management
Queue wait time is the single fastest lever to conversion improvement in Indian retail. Agrex AI’s footfall analytics fires WhatsApp alerts to floor managers when queue lengths exceed thresholds – opening additional checkout lanes before customers abandon their baskets. Across Agrex retail deployments, this single feature accounts for a -26% reduction in average queue wait time.
3. Staff Scheduling Optimization
Matching staff deployment to actual retail footfall data patterns cuts both labor cost and lost sales. Stores that schedule purely from historical convention are either overstaffed during slow periods or understaffed during peak hours. Footfall analytics provides week-by-week traffic profiles that scheduling managers use to build data-driven rosters.
4. Marketing Campaign Measurement
For the first time, Indian retailers can measure the real-world impact of advertising and promotions with hard footfall tracking data. Compare store traffic before and after a campaign launch. Correlate outdoor advertising locations with entrance-specific traffic increases. Footfall analytics closes the attribution gap between offline marketing spend and physical store outcomes.
5. Window Display and VM Testing
Visual merchandising teams use passerby-to-walk-in conversion rates from footfall analysis retail data to A/B test window display concepts. Hard data replaces instinct in VM decisions.
6. Multi-Store Performance Benchmarking
Regional managers use footfall analytics to compare conversion rates and peak hour profiles across their entire portfolio. Identify which stores convert traffic efficiently and replicate their approaches across the network.
Footfall Analytics Technologies Compared
Four main technologies compete for retail footfall data collection. They differ significantly in accuracy, cost, and analytical capability.
| Technology | Accuracy | Uses Existing CCTV? | Beyond Counting? |
|---|---|---|---|
| AI Deep Learning (Agrex AIVIS) | 95-98% | Yes | Dwell time, queues, demographics, heatmaps, conversion |
| Thermal Sensors | 80-85% | No – dedicated hardware | Basic counting only |
| Stereo Vision Cameras | 90-95% | No – specialized 3D cameras | Height-based filtering, zone counting |
| WiFi / BLE Tracking | 60-75% | No – requires beacons | Repeat visit detection (opt-in only) |
KEY INSIGHT
AI-based footfall analytics on existing CCTV is the only technology that delivers 95%+ accuracy, works without hardware investment, AND provides all six key metrics from a single infrastructure. This is why the technology has become the default choice for Indian retail chains with more than 10 stores.
Real Results: Indian Retail Chains Using Footfall Analytics
Across Agrex AI’s retail customer base – including Bata India, Pantaloons (ABFRL), and M&S India – footfall analytics deployments have delivered consistent, measurable outcomes.
The retailers achieving these results treat footfall analytics as an operational tool, not a reporting metric. Store managers receive real-time queue alerts and daily zone traffic summaries. Regional teams get weekly conversion comparison reports. Head office merchandisers pull monthly heatmap data to inform planogram decisions.
Pantaloons (ABFRL) deployed Agrex AI’s footfall tracking platform for fixture-replacement and ambient-lighting monitoring – using real-time footfall analysis to measure the impact of store environment changes on customer dwell time and purchase behavior.
Footfall Analytics for Different Retail Formats
Fashion and Apparel
Focus metrics: zone-specific dwell time (fitting room, high-margin sections), gender distribution by zone, dwell-to-purchase ratio by category.
Electronics and Durables
Focus metrics: dwell time at product displays, staff-to-customer ratio during peak hours, conversion rate by product zone. Electronics stores use footfall analysis retail data to measure whether demo stations generate purchase intent.
Supermarkets and Grocery
Focus metrics: queue wait time (highest priority), peak hour profiles, end-cap and promotional zone traffic. Grocery retailers use retail footfall data primarily for staff scheduling and checkout management.
Department Stores
Large format stores use footfall analytics to understand which floors and departments drive the overall store visit and which are underperforming relative to their floor area.
How to Choose a Footfall Analytics Platform
The Indian market now has dozens of vendors claiming footfall analytics capability. Here is the checklist retail leaders use to separate genuine AI platforms from basic counters rebranded as analytics.
- Works on existing CCTV – Any platform requiring hardware replacement across your store network adds cost and deployment time that erases ROI. Demand proof that the system works on your existing cameras.
- 95%+ counting accuracy with documentation – Ask for validation methodology, not just a claimed number.
- Real-time alerts, not just reports – Queue management only works if alerts reach floor staff in real time.
- POS integration for true conversion rates – Without connecting footfall tracking data to transaction data, you have traffic counts but no conversion measurement.
- Multi-store dashboard – For chains, you need store-by-store comparison, regional rollups, and drill-down capability.
- Privacy-first architecture – All analytics should run on anonymized data. No facial recognition, no personal data storage, no cloud egress of raw video.
- Proven Indian retail deployments – Ask for named Indian retail customer references with verifiable results.
PRO TIP
Before committing to any footfall analytics platform, run a 2-week pilot on a single store. Define your three priority metrics upfront (queue wait time, zone dwell time, conversion rate). If the vendor cannot produce those three numbers accurately from your existing cameras within the pilot window, no enterprise contract will deliver ROI.
Agrex AI’s AIVIS footfall analytics platform meets every criterion on this list. It works with any RTSP/ONVIF camera, integrates with major POS and BI systems, processes all data at the edge (no cloud video egress), and has verified deployments across 60+ Indian enterprise retail customers. See our retail video analytics solution or book a free demo.
ROI and Business Impact of Footfall Analytics
Indian retailers calculate footfall analytics ROI across three dimensions: revenue improvement, cost reduction, and operational efficiency.
Revenue improvement comes from conversion rate optimization. A store with 500 daily visitors at 15% conversion generates 75 transactions. Moving conversion to 18% – achievable through queue management and zone optimization alone – generates 90 transactions per day. At an average basket size of Rs. 2,000, that is Rs. 30,000 additional daily revenue per store. Across a 50-store chain, that is Rs. 1.5 crore per day in additional revenue from footfall analytics-driven improvement.
Cost reduction comes primarily from staff scheduling optimization. Matching staff deployment to actual retail footfall data patterns typically reduces unnecessary labor hours by 10-15% without impacting service quality during peak periods.
According to NASSCOM’s 2026 retail AI report, Indian retailers deploying AI-powered footfall analytics report median payback periods of 9-14 weeks, with the fastest paybacks consistently achieved in chains that deploy queue management and staff scheduling modules first.
Frequently Asked Questions About Footfall Analytics
What is footfall analytics?
Footfall analytics is the measurement and analysis of customer movement inside a physical retail store using AI-powered cameras. It tracks how many people enter, which zones they visit, how long they stay, how long they wait in queues, and whether they make a purchase. Modern footfall analytics platforms like Agrex AI use existing CCTV cameras – no new hardware required.
How does AI footfall analytics differ from basic people counters?
Basic people counters provide raw headcounts at a single entrance point. AI footfall analytics tracks full customer journeys through every zone, measures dwell time by department, detects queue formation in real time, and correlates retail footfall data with POS transactions to calculate true conversion rates. AI systems achieve 95-98% accuracy versus 70-80% for older sensor counters.
What footfall metrics matter most for Indian retail?
The six most impactful metrics are: zone-specific footfall, dwell time by zone, queue wait time, dwell-to-purchase conversion ratio, gender and demographic distribution, and peak hour analysis. Indian chains using these six metrics via Agrex AI have recorded +17% conversion, +14% footfall, and -26% queue wait times within 11 weeks.
Do I need new cameras for footfall analytics?
No. AI-based footfall analytics platforms like Agrex AI work with your existing IP CCTV cameras. Agrex AIVIS connects to any RTSP/ONVIF-compatible camera. There is no hardware replacement and most deployments go live within 7-10 days of kickoff.
How quickly can footfall analytics show ROI?
Most Indian retailers see measurable ROI within 4-8 weeks. Agrex AI retail customers achieve 11-week ROI payback with +17% conversion improvement and -26% queue wait reduction.
Which Indian retail chains use footfall analytics?
Leading Indian retail chains using Agrex AI’s footfall analytics platform include Bata India, Pantaloons (ABFRL), and M&S India. Results include +17% conversion, +14% higher footfall, and -26% queue wait reduction within 11 weeks.
Conclusion: Making Footfall Analytics Work for Your Stores
Indian retail has moved past the era of guessing. Every major retail chain now has the ability to measure exactly what customers do inside their stores – which zones attract attention, where purchase decisions are made, how long queues form, and which stores convert traffic into revenue. The technology runs on cameras already installed. The data is available in real time. The ROI arrives within weeks.
The retailers not yet using footfall analytics are making decisions based on instinct. The retailers using it are making the same decisions based on data. The gap in conversion rates between these two groups currently averages 5-8 percentage points across comparable Indian retail formats.
Agrex AI’s AIVIS platform delivers enterprise-grade footfall analytics on your existing cameras, with verified results across 60+ Indian enterprise retail customers. See how it works or book a free demo.
ABOUT THE AUTHOR
Dhruv Jearath
Dhruv Jearath is a digital marketing strategist at Agrex AI specialising in SEO, content strategy, and demand generation for enterprise AI and video analytics markets. He writes on AI-powered retail analytics, footfall tracking, video analytics deployment, and edge AI – backed by direct experience scaling Agrex AI’s digital presence across 100+ enterprise clients and 12 industries in India.