Only 3 in 10 shoppers who walk into an Indian retail store actually make a purchase — yet most store operations teams still optimise purely on sales data. Footfall analytics changes that equation entirely. It turns every customer entry, aisle pause, and queue abandonment into a measurable signal you can act on — today, not at the end of the month.
The problem is familiar to every Store Operations Head and Retail VP in India: you know your revenue figures, but you do not know why conversion dipped on Saturday afternoon, why Zone B consistently underperforms, or why a queue spike at 6 pm costs you 40 potential sales every week. Sales dashboards tell you what happened. Footfall data tells you why.
In this guide, you will discover how footfall tracking works at the hardware and AI layer, which five in-store metrics actually predict revenue lift, and how Indian multi-format chains — fashion, electronics, supermarkets — have used retail footfall data to drive measurable same-store sales growth without a data science team or a 12-month rollout.
Table of Contents
- What Is Footfall Analytics — and Why Your Dashboard Is Lying
- How Footfall Tracking Works: Sensors, Cameras, and AI Compared
- The 5 Retail Footfall Metrics That Actually Predict Conversion
- How Indian Retail Chains Use Footfall Data to Lift Same-Store Sales
- What to Look for in a Footfall Analytics Platform
- FAQ — Footfall Analytics for Indian Retail
What Is Footfall Analytics — and Why Your Current Dashboard Is Lying to You
Most retail reporting tools are built around the point-of-sale system. They measure transactions, basket size, and returns — but say nothing about the 70% of visitors who browsed, considered, and left without buying. Footfall analytics fills that blind spot. For Indian multi-format chains operating in high-traffic mall and high-street environments, that blind spot is where margin is lost every single day.
Quick Answer
Footfall analytics is the measurement and analysis of customer movement inside a physical retail space. It works by capturing entry counts, dwell time, zone traffic, and conversion rates using sensors or AI cameras. Most commonly used for store layout optimisation, staffing decisions, and retail footfall data-driven conversion improvement.
A 2024 Deloitte India Consumer Survey found that 61% of retail purchase decisions are influenced by in-store experience — not price. Yet most Indian retailers allocate zero budget to measuring that experience in real time. The result: store managers optimise what they can see (stock levels, POS queues) and remain blind to what drives or kills conversion — zone engagement, dwell time, and traffic-to-staff ratios.
Why Sales Data Alone Creates False Confidence
A store posting ₹18 lakh in weekend revenue looks healthy on a dashboard. But if 2,400 people walked in and only 310 converted, the real story is a 13% conversion rate — well below the 22–28% benchmark for fashion retail in India. Without footfall tracking data, the operations team never surfaces that insight.
The Metric Gap Most Indian Retailers Don’t Know They Have
Sales data has a selection bias: it only captures customers who said yes. Footfall analytics captures every customer — including the ones who said no. That population is where your largest retail conversion opportunity lives.
How Footfall Tracking Works: Sensors, Cameras, and AI Compared
Understanding the technology layer matters for procurement decisions. Footfall tracking has evolved from basic infrared beam counters to full retail video analytics — and the accuracy gap between them is significant enough to change which business decisions you can trust the data for. Retailers evaluating platforms need to know exactly what each technology can and cannot measure before committing budget.
Quick Answer
Footfall tracking is the process of counting and analysing customer movement using hardware sensors or AI-powered cameras. It works by detecting and classifying individuals as they enter, move through, or exit a space. Most commonly used in retail footfall analysis to measure traffic volume, zone dwell time, queue length, and staff-to-visitor ratios.
Infrared and Beam Counters
Basic beam counters count interruptions in an infrared beam at store entrances. Accuracy ranges from 70–80% in high-traffic environments. They count entries but cannot distinguish adults from children, staff from customers, or direction of travel — producing volume data with no behavioural insight.
Overhead 3D Sensors
Time-of-flight and stereo vision sensors mounted at doorways provide 90–95% count accuracy. They handle bidirectional flow and can exclude staff via uniform detection rules. Still limited to entry zones — no zone-level footfall analysis retail teams actually need for decisions inside the store.
AI Video Analytics (Computer Vision)
AI video analytics systems like AIVIS from Agrex AI use computer vision models trained on Indian retail environments. They deliver 95–98% count accuracy, plus zone-level dwell time, queue detection, age-gender demographics, heatmaps, and footfall analytics conversion rate calculation — all in real time. A single camera covers multiple zones simultaneously, making total deployment cost competitive with multi-sensor alternatives.
According to RetailNext’s 2024 Retail Analytics Benchmark, retailers using AI-based video analytics saw a 2.3× improvement in actionable insight generation vs. sensor-only deployments. This gap is even more pronounced in Indian multi-format retail, where store layouts change seasonally and zone-level data is essential.
The 5 Retail Footfall Metrics That Actually Predict Conversion
Not all retail footfall data is equally useful. Most platforms surface volume metrics — daily counts, peak hour charts — that feel informative but drive no decisions. The five metrics below are the ones Agrex AI‘s deployment team consistently finds predict same-store revenue performance across fashion, electronics, and supermarket formats in India.
Quick Answer
The five retail footfall metrics that best predict conversion are: visitor-to-transaction conversion rate, zone dwell time, bounce rate by zone, queue abandonment rate, and dwell-to-purchase ratio. Each isolates a specific friction point in the customer journey. Together, they explain why sales lift or fall independently of footfall tracking volume.
1. Visitor-to-Transaction Conversion Rate
Total transactions ÷ total footfall entries in the same period. This is the single most important KPI in retail operations. A 2% conversion rate improvement on a 1,000-visitor-per-day store equals 20 additional transactions daily — without spending a rupee on acquisition. Footfall analytics makes this metric visible in real time, not just at month-end.
2. Zone Dwell Time
How long customers spend in each section of the store. High dwell time with low adjacent conversion points to a merchandising or staff assistance gap. Low dwell time in a high-margin zone (e.g., premium footwear at Bata India) signals a layout or signage problem — both fixable once visible via retail footfall data.
3. Zone Bounce Rate
The percentage of visitors who enter a zone and exit within under 10 seconds. A consistently high bounce rate in a promoted zone means the visual merchandising is not matching customer expectation — a fixable problem once your footfall analysis retail system surfaces it.
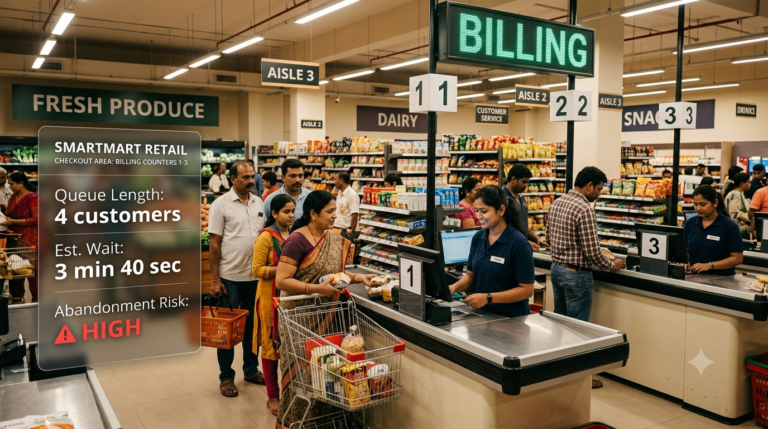
4. Queue Abandonment Rate
The percentage of customers who join a checkout queue and leave before completing purchase. This metric directly measures lost revenue. A 3-minute average wait threshold is where abandonment rates spike in Indian grocery and fashion retail. Real-time queue alerts from AIVIS Retail solve this at the store level.
5. Dwell-to-Purchase Ratio
The ratio of customers who exceed a dwell time threshold in a zone to those who actually purchase from it. This is the metric most Indian retailers do not track — and it is a stronger conversion signal than raw footfall count. A customer who dwells for 90 seconds is 4× more likely to purchase. Knowing which zones convert dwellers and which do not tells you exactly where to intervene with staff or merchandise.
How Indian Retail Chains Use Footfall Data to Lift Same-Store Sales
The gap between knowing footfall analytics exists and understanding how Indian multi-format retailers operationalise it is where most evaluation conversations stall. The results below come from live deployments of AIVIS Retail by Agrex AI — not benchmarks or projections — across Bata India, Pantaloons (ABFRL), and Marks & Spencer India.
Quick Answer
Indian retail chains use footfall data to optimise staffing schedules, rearrange zone layouts, reduce queue wait times, and identify conversion gaps by store and hour. Retailers using AI-based footfall analytics platforms have recorded double-digit conversion rate improvements within 90 days of deployment, without increasing marketing spend.
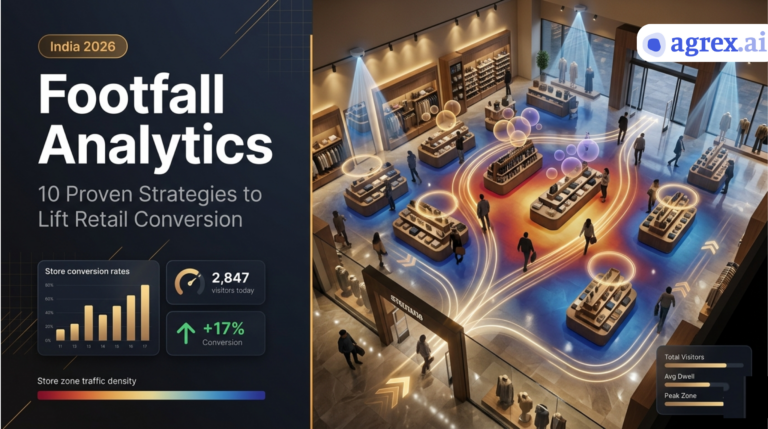
Across deployments at Bata India, Pantaloons, and Marks & Spencer India, AIVIS Retail customers achieved:
- +17% conversion rate improvement — driven by zone-level dwell and footfall tracking insights that enabled targeted staff repositioning
- +14% footfall increase — achieved through data-informed window display and entrance experience changes based on retail footfall data
- −26% reduction in queue wait times — by using real-time queue length alerts from footfall analytics to dynamically open additional counters
All three results were achieved within 11 weeks of AIVIS Retail deployment, with no POS system replacement or ERP integration required in Phase 1.
Expert Insight
“What surprises most Store Operations teams when they first see footfall data is not the conversion rate — it is the volume of near-misses. In one Pantaloons deployment, we found that 34% of customers who spent more than two minutes in the premium denim section left without a staff interaction. That is not a product problem. That is an operational gap that no sales report would have surfaced. The moment you see customer behaviour at zone level, your staffing and merchandising decisions stop being gut-feel and start being evidence-based.”
— Arush Kakkar, Co-founder & CEO, Agrex AI
Original Agrex AI Insight: Based on deployment data across Indian retail formats, the dwell-to-purchase ratio is a stronger leading indicator of conversion performance than raw footfall count. Stores that optimise for dwell-to-purchase ratio rather than traffic volume consistently outperform their cluster peers on same-store sales growth within two quarters. Most Indian retailers using basic footfall tracking systems miss this entirely.
What to Look for in a Footfall Analytics Platform (and What to Ignore)
The Indian retail analytics market is crowded with point solutions that count footfall but cannot connect it to store performance. Evaluating a footfall analytics platform requires separating genuine capability from dashboard aesthetics — particularly for multi-format chains needing consistent retail footfall data across fashion, electronics, and grocery formats under one reporting layer.
Quick Answer
A footfall analytics platform should provide real-time zone-level data, conversion rate calculation, queue detection, and multi-store dashboards as standard. Avoid platforms that only deliver daily entry counts or require ERP integration before producing insight. Prioritise vendors with proven footfall analysis retail deployments in India and documented accuracy above 95%.
Must-Have Capabilities
Real-time alerts (not just end-of-day reports), zone-level heatmaps, conversion rate calculation without POS API dependency, staff-exclusion logic, and queue length monitoring. These are table-stakes for an operations team making decisions during a trading day — not after it. Any serious retail footfall data platform delivers all of these on Day 1.
Strong Differentiators
Age-gender demographic overlays, dwell time by product category, cross-store benchmarking, and integration with workforce management systems. These capabilities move footfall analytics from reporting to operational intelligence. Platforms like AIVIS, which also powers QSR video analytics deployments, deliver this layer out of the box — the same platform that runs footfall for Bata and Pantaloons also serves QSR chains and logistics operations.
What to Ignore
Vanity metrics: total monthly footfall rank, national average benchmarks, year-on-year traffic index. Also avoid platforms that pitch custom ML model development as a feature — your team needs a configured, tested footfall tracking system on Day 1, not a research project that delivers results in 6 months.
CBRE India’s Retail Real Estate Report 2024 noted that Indian retailers who deployed AI-based in-store analytics saw a median payback period of 7.2 months — significantly faster than traditional BI tool implementations averaging 14–18 months. The gap widens further for retailers who deploy footfall analytics at scale across 20+ stores.
FAQ — Footfall Analytics for Indian Retail
What is footfall analytics in retail?
Footfall analytics in retail is the collection and analysis of data about how many customers enter a store, which zones they visit, how long they stay, and how many make a purchase. It works by using entry sensors or AI cameras to track movement throughout the store. Most commonly used to optimise staffing, store layout, and checkout capacity in real time.
How accurate is AI-based footfall tracking?
AI-based footfall tracking using computer vision achieves 95–98% count accuracy in production retail environments — significantly higher than infrared beam counters (70–80%). AIVIS Retail by Agrex AI is validated at above 96% accuracy across multi-format Indian retail stores including Bata India, Pantaloons, and Marks & Spencer India.
How is footfall data different from sales data?
Sales data records only completed transactions — customers who said yes. Retail footfall data records every store visit, including those who browsed and left without purchasing. In most Indian retail formats, 70–80% of visitors do not convert. Footfall analytics reveals why: which zones are losing engagement, where queues cause abandonment, and which hours have high traffic with no corresponding staff coverage.
How long does it take to see ROI from footfall analytics?
Most Indian retail chains deploying AI footfall analytics see measurable conversion improvements within 6–11 weeks of go-live. Full ROI payback typically falls between 6 and 9 months for multi-store deployments. AIVIS Retail customers at Bata India, Pantaloons, and Marks & Spencer India recorded a +17% conversion improvement and −26% queue time reduction within 11 weeks — ahead of the industry median of 7.2 months. [CBRE India, 2024]
Footfall analytics is not a reporting upgrade — it is an operational capability that changes how store teams make decisions in real time. The retailers pulling ahead in same-store sales growth are the ones who have moved from transaction-only dashboards to full in-store behavioural data via retail video analytics. The five metrics covered here — conversion rate, dwell time, bounce rate, queue abandonment, and dwell-to-purchase ratio — are where that advantage is built. As Indian multi-format chains continue facing pressure on footfall and margins, the retailers with the clearest view of in-store customer behaviour will consistently outperform those flying blind on sales data alone.
Ready to see your stores differently?
See how AIVIS Retail tracks footfall analytics, dwell time, and conversion across all your stores.
Book a Free Demo at agrexai.com →Arush Kakkar
Founder & CEO, Agrex AI
Arush Kakkar is the Founder of Agrex AI, the leading provider of AI-driven video analytics solutions for physical establishments. He leads a team of engineers and data scientists who use artificial intelligence and machine learning to help businesses improve performance, protect customers and staff, and ensure compliance with safety standards.
His mission is to help businesses make better decisions using their existing CCTV footage — by detecting policy violations, identifying suspicious activity, and improving customer engagement. He is passionate about creating innovative solutions that leverage computer vision and deep learning.
Arush is also a published author and computer vision researcher with over 5 years of experience in the field. He has published two books on the Raspberry Pi platform for building computer vision products, and has contributed to research on self-driving cars, autonomous drones, and medical imaging. View author profile →