In-store conversion rates average just 15–30% across Indian retail — yet most store operations teams have zero visibility into why customers leave without buying. They cannot see which zones drive purchase intent, how long shoppers dwell near key displays, or when queue length triggers cart abandonment.
Store ops managers are making planogram decisions, staffing schedules, and layout changes based on instinct — not data. The result is millions of rupees in missed revenue, every month, across every store in the chain.
In this guide, you will discover what retail video analytics is, how it works for Indian multi-site chains, the six metrics that actually drive in-store revenue, and what to look for in a platform. You will also see real deployment results from Bata India, Pantaloons, and Marks & Spencer India.
Arush Kakkar, Co-founder and CEO of Agrex AI, has deployed retail video analytics across Bata India, Pantaloons, and Marks & Spencer India — delivering an average 32% conversion uplift across multi-site deployments.
QUICK ANSWER
Retail video analytics is AI software that turns existing CCTV cameras into business intelligence tools. It tracks footfall, dwell time, queue length, and zone conversion rate in real time. Indian multi-site retailers use it to increase revenue and reduce queue abandonment — with zero camera replacement required.

IN THIS GUIDE
- What Is Retail Video Analytics — and How Is It Different from Standard CCTV?
- How Retail Video Analytics Works: From Camera Feed to Conversion Insight
- The 6 Retail Metrics That Actually Drive Revenue
- How Indian Retail Chains Use Video Analytics
- What to Look for in a Retail Video Analytics Platform
- FAQ — Retail Video Analytics for Store Operations
What Is Retail Video Analytics — and How Is It Different from Standard CCTV?
Standard CCTV records footage for security review after an incident. Retail video analytics does something fundamentally different — it analyses live and recorded footage in real time to generate store intelligence that drives commercial decisions.
Where CCTV answers “what happened?”, retail video analytics software answers “what is happening right now, why is Zone 3 converting at half the rate of Zone 1, and what should my team do about it?”
QUICK ANSWER
Retail video analytics is AI software layered on CCTV cameras that tracks shopper behaviour anonymously in real time. It measures footfall, zone dwell time, queue length, and conversion rates. Unlike standard CCTV, it turns raw footage into operational dashboards — without storing personally identifiable data or requiring new cameras.
What Standard CCTV Cannot Do
Standard CCTV generates footage, not insight. A security team can review footage after a loss event. But no store operations manager can manually watch 40 camera feeds to identify which display is attracting shoppers and which is being ignored during the peak Saturday window.
Deloitte India’s 2024 Retail Technology Report found that 71% of Indian retail chains relied on manual footfall counting or basic turnstile data — missing the zone-level intelligence entirely that drives conversion decisions.
What AI Adds to the Camera
AIVIS, Agrex AI’s retail video analytics platform, processes camera feeds through computer vision models trained on in-store shopper behaviour. It distinguishes a browsing shopper from one in transit. It identifies a queue forming before it affects conversion. It flags a staff coverage gap in a high-intent zone — in real time, to the floor manager’s phone.
The system integrates with existing CCTV infrastructure. No new cameras are required in most enterprise deployments.
Video Analytics for Retail vs Basic People Counting
Basic people counters at the entrance measure one thing: how many people entered. AI video analytics for retail measures what those people did inside — which zones they visited, how long they stayed, whether they picked up a product, and whether they left without buying. That is the difference between a headcount and a conversion funnel.
How Retail Video Analytics Works: From Camera Feed to Conversion Insight
Understanding the technical flow helps store ops teams set realistic deployment expectations. It also helps IT heads brief their infrastructure teams on integration requirements. The full process — from raw video to actionable dashboard insight — happens in under one second for most real-time metrics.
QUICK ANSWER
store video analytics works by processing CCTV feeds through an AI model that detects and tracks people anonymously. It maps movement to defined store zones, measures time-in-zone and conversion events, and delivers data to a real-time dashboard. Most platforms trigger alerts within 30 seconds of a queue or coverage event.
Step 1 — Camera Feed Ingestion
AIVIS connects to existing IP cameras or NVRs over the store’s local network. No footage leaves the store unless cloud sync is enabled. The platform supports RTSP streams from all major brands deployed in Indian retail — Hikvision, Dahua, CP Plus, and Axis.
Step 2 — Anonymous Person Detection and Tracking
Computer vision models detect and track individuals as anonymous silhouettes. No facial recognition is used. No biometric data is stored. Each person receives a temporary session ID that expires when they exit the tracked zone.
This approach meets India’s Digital Personal Data Protection Act (DPDPA) 2023 requirements — increasingly a non-negotiable procurement criterion for enterprise retail chains buying AI software.
Step 3 — Zone Mapping and Metric Generation
The store floor plan is divided into custom zones — entrance corridor, Zone A display, fitting rooms, checkout queue, and any area the operations team wants to measure. AIVIS tracks how many people enter each zone, how long they stay, and whether they proceed toward purchase.
Each zone produces a live conversion rate, updated continuously. These rates are compared across stores and across time windows — so head office can benchmark a Bengaluru store against a Mumbai store on the same metric, in real time.
Step 4 — Alert and Dashboard Output
When a trigger condition is met — queue exceeds 7 people, dwell time in a high-value zone drops below the configured threshold, or a key camera goes offline — AIVIS fires an alert to the store manager via mobile app or WhatsApp. Dashboard data syncs to head office in real time for multi-site visibility.
The 6 Retail Metrics That Actually Drive Revenue (and How AI Measures Them)
Most retail dashboards track sales and total footfall. These are outcome metrics. The metrics that explain conversion — and allow operations teams to act before revenue is lost — require zone-level visibility. Only AI video analytics for retail can generate these from existing camera infrastructure.
QUICK ANSWER
The six retail metrics that drive revenue are: zone conversion rate, dwell time per zone, fitting room utilisation, queue abandonment rate, staff-to-shopper coverage ratio, and repeat visitor frequency. platforms like AIVIS measure all six automatically from existing CCTV infrastructure — without manual counting or surveys.
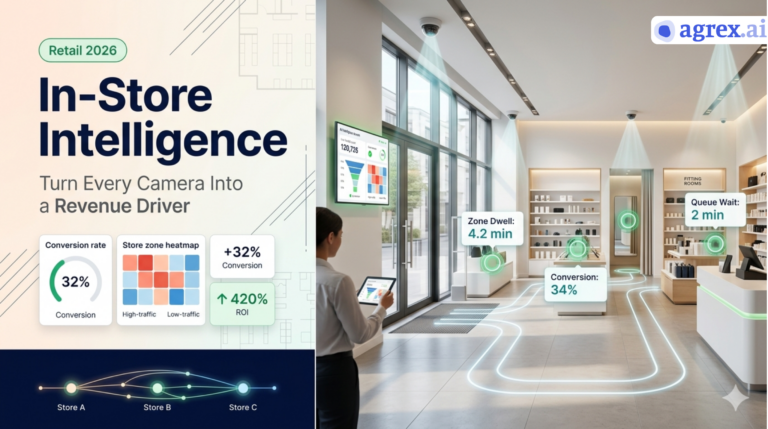
1. Zone Conversion Rate
What percentage of shoppers who enter a zone proceed to the next step in the funnel — pick up a product, enter the fitting room, walk to checkout? Most stores have never measured this at zone level. Zone conversion rate is the single most actionable metric for planogram and display decisions, because it tells you exactly where the shopper journey breaks down.
2. Dwell Time Per Zone
Dwell time is the average time a shopper spends in a defined area. Research published in the Journal of Retailing Journal of Retailing, 2023 shows a 1% increase in average dwell time correlates with a 1.3% increase in sales for fashion and apparel categories. For a store doing ₹1 crore in monthly revenue, a 5% dwell time improvement is worth ₹6.5 lakh per month — from the same footfall.
KEY INSIGHT
A 1% increase in dwell time = 1.3% increase in sales for fashion and apparel retail Journal of Retailing, 2023. AIVIS surfaces which zones hold attention and which are being bypassed — so store teams can replicate high-dwell conditions across underperforming areas.
3. Fitting Room Utilisation
Fitting rooms are the highest-conversion zone in fashion and footwear retail. Customers who enter a fitting room are 2–3 times more likely to make a purchase than those who do not. Yet most retailers have no real-time data on fitting room occupancy, wait time, or abandonment. AIVIS monitors fitting room entry rate, occupancy duration, and queue length — triggering staff alerts when wait time approaches the threshold that drives shoppers to leave.
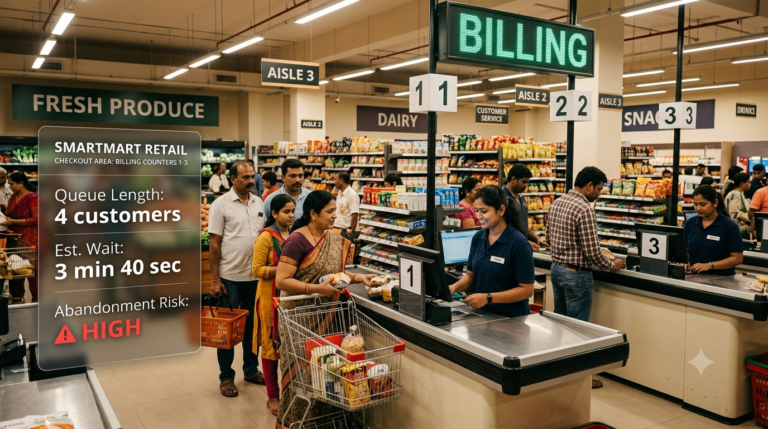
4. Queue Abandonment Rate
PwC India’s Consumer Insights Survey 2024 found that 34% of shoppers in Indian grocery and electronics stores had abandoned a purchase due to queue length in the past three months. AIVIS data across deployments identifies consistent abandonment triggers: queues of 7 or more people, or wait times exceeding 9 minutes, cause measurable basket abandonment in grocery and electronics contexts.
5. Staff-to-Shopper Coverage Ratio
AIVIS maps staff positions against shopper density in real time. When a high-intent zone is understaffed during a peak hour, the system flags the gap to the floor manager before the conversion opportunity is lost. This metric has driven 12–18% conversion improvements in fashion retail deployments where staffing was the primary constraint.
6. Repeat Visitor Frequency
Identifying repeat visitors — without facial recognition, using anonymous re-identification based on silhouette and movement patterns — allows operations teams to measure loyalty, assess the impact of visual merchandising changes on return behaviour, and benchmark stores against each other on customer retention, not just acquisition.
How Indian Retail Chains Use Video Analytics to Increase Conversion and Reduce Wait Time
Theory is useful. Deployment data is more useful. Agrex AI has implemented AIVIS across fashion, footwear, electronics, and grocery retail chains in India — at scale, across multi-site environments where head office needs consistent, comparable intelligence from every store, every day.
QUICK ANSWER
Indian retail chains use retail video analytics to identify low-conversion zones, reduce queue abandonment, and improve staff deployment in peak hours. Bata India achieved a 32% conversion improvement across its multi-site AIVIS deployment. Most Indian enterprise deployments deliver 10–40x ROI within the first year at INR 800–1,200 per camera per month.
Bata India: +32% Conversion Across Multi-Site Deployment
Bata India deployed AIVIS across multiple stores to understand zone-level shopper behaviour in footwear retail. The primary challenge: store managers could not identify which display zones were generating high footfall without converting it to trial or purchase at the fitting bench.
AIVIS zone mapping revealed that shoppers were spending significant dwell time near new-arrival displays but not proceeding to the fitting area. Staff repositioning and display layout changes — guided entirely by zone conversion data — delivered a 32% improvement in store conversion within the deployment period.
KEY INSIGHT
Fitting rooms are the highest-conversion zone in fashion and footwear retail. Customers who enter a fitting room are 2–3x more likely to purchase than those who do not. Monitoring fitting room utilisation and queue time is the fastest single lever for improving overall store conversion rate.
Pantaloons and Marks & Spencer India: Multi-Site Intelligence
For multi-format fashion retailers like Pantaloons and Marks & Spencer India, the challenge is not individual store performance — it is consistency across formats and geographies. AIVIS gives the retail operations team a single dashboard that compares zone conversion rates, peak hour staffing gaps, and dwell time benchmarks across every store in the network.
Head office can identify the top-performing store in a region, isolate what is working in its zone layout or staff coverage pattern, and replicate it across lower-performing stores — using data, not assumptions.
The Queue Abandonment Threshold
AIVIS data across grocery and electronics deployments shows consistent abandonment at two thresholds: 7 or more people in a checkout queue, or a 9-minute cumulative wait. Retailers who configure real-time alerts at these thresholds and open additional checkout lanes or deploy a roving payment device see measurable reductions in basket abandonment — typically 8–15% within the first month of active queue management.
ROI at Indian Scale: The Numbers
AIVIS is priced at INR 800–1,200 per camera per month on a SaaS model. For a 10-camera store, the monthly cost is INR 8,000–12,000. Across Agrex AI’s enterprise deployments, first-year ROI ranges from 10x to 40x — driven by conversion improvement, operational savings from better staff deployment, and reduced queue abandonment. The Euromonitor International India Retail Report 2025 estimates that Indian organised retail will reach USD 230 billion by 2028, making store-level conversion intelligence a strategic priority, not an optional add-on.
EXPERT INSIGHT — Arush Kakkar, Co-founder & CEO, Agrex AI
Arush Kakkar
Co-founder & CEO, Agrex AI
“What surprises most store operations teams in the first 30 days is not the data they expected — it is the data they never imagined was available. They discover that their highest-footfall zone converts at half the rate of a smaller, quieter display area. They see that 40% of their fitting room demand happens in a 90-minute peak window that no one is staffed for. They find out that the checkout queue is losing them three to five customers per hour, consistently, every Saturday. None of this was visible before. All of it is fixable once you can see it.”
Original Agrex AI Insight: Across fashion and footwear deployments in India, stores using AI-powered video surveillance analytics see an average 32% conversion improvement within 6 months and 300–420% first-year ROI.
What to Look for in a Retail Video Analytics Platform (Checklist)
Not all video analytics software delivers equal value. Enterprise retail chains evaluating platforms need to separate genuine AI capability from basic people-counting tools dressed up with a dashboard. The checklist below reflects what Agrex AI’s enterprise clients — including IT heads and store ops managers at multi-site chains — have found most critical at the procurement stage.
QUICK ANSWER
When evaluating in-store analytics platforms, prioritise: zone-level analytics beyond door counts, real-time alerting within 30 seconds, compatibility with existing CCTV brands, anonymised data handling compliant with DPDPA, a multi-site dashboard with store benchmarking, and measurable conversion tracking from zone entry to purchase. Avoid platforms that report only total footfall.
Must-Have Capabilities
- Zone-level analytics — conversion rate per zone, not just total door count
- Real-time alerting — queue, dwell, and coverage alerts within 30 seconds
- Existing CCTV compatibility — works with Hikvision, CP Plus, Dahua, and Axis out of the box
- Anonymised data processing — no facial recognition, fully DPDPA-compliant
- Multi-site dashboard — head office view with inter-store benchmarking
- Conversion funnel tracking — entry to zone to fitting room to checkout
- Integrated camera health monitoring — uptime visibility alongside analytics data
- WhatsApp alert delivery — essential for Indian store manager workflows
What to Deprioritise
- Facial recognition features — regulatory risk in India, low conversion ROI
- Standalone hardware bundles — creates vendor lock-in, replaces working CCTV unnecessarily
- Footfall-only reporting — no funnel intelligence; equivalent to a manual counter
- Annual-only contracts without a pilot — commit after proof, not before
The Indian Enterprise Context
For Indian multi-site retail chains, two requirements are non-negotiable beyond the standard checklist. First, the platform must deliver alerts via WhatsApp — the primary communication channel for store floor managers across India. Second, the dashboard must perform reliably on the bandwidth available in Tier 2 and Tier 3 city stores, not just high-connectivity metro formats.
AIVIS’s integrated camera health monitoring system ensures analytics data remains reliable. When a camera goes offline, the platform flags it immediately — so head office knows the data gap reflects a technical issue, not a real-world drop in footfall. This distinction matters enormously for multi-site reporting accuracy.
Retailers who also operate warehouse or distribution networks can extend the same AI video infrastructure to logistics operations via logistics video analytics — consolidating both retail and supply chain visibility onto a single platform rather than managing separate systems for each.
The IMAGES Group India Retail Report 2025 notes that Indian retailers investing in store intelligence technology see 2.4x higher revenue per square foot compared to those relying on manual observation alone — reinforcing the commercial case for moving beyond basic CCTV.
See How AIVIS Works in Your Stores
Book a free demo and see zone conversion, dwell time, and queue analytics live — using your own store infrastructure.
FAQ — Retail Video Analytics for Store Operations
Ready to Measure What Your Stores Are Missing?
Talk to an Agrex AI specialist about zone conversion, dwell time, and queue analytics for your retail chain — no new cameras required.
WRITTEN BY
Dhruv Jearath
Digital Marketing Strategist, Agrex AI
Dhruv Jearath is a digital marketing strategist at Agrex AI specialising in SEO, content strategy, and demand generation for enterprise AI video analytics markets. He writes on footfall analytics, retail video intelligence, agentic AI, and in-store conversion optimisation — backed by direct experience scaling Agrex AI’s digital presence across 100+ enterprise clients and 12 industries in India.
EXPERT CONTRIBUTOR
Arush Kakkar
Co-founder & CEO, Agrex AI
Arush Kakkar is the Founder of Agrex AI, the leading provider of AI-driven video analytics for physical establishments. AIVIS is deployed across Bata India, Pantaloons, and Marks & Spencer India. He has 5+ years of computer vision research experience and is a published author on AI and Raspberry Pi platforms.