What Is QSR Video Analytics?
Last updated: August 2026
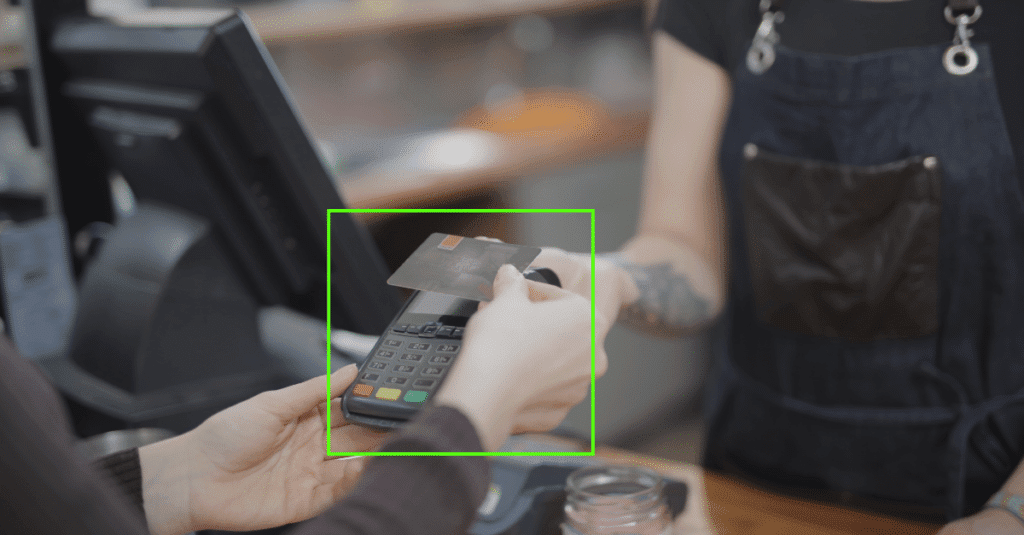
QSR video analytics turns footage from restaurant cameras into operational measurements such as queue length, wait time, service time, throughput and SOP compliance. Computer-vision models detect events in defined zones, convert those events into metrics, and alert managers when a workflow falls outside an agreed threshold.
Traditional CCTV helps teams review what happened. Video analytics is designed to show where a process is slowing down now, how often it happens, and which action a restaurant manager can take. The most useful systems measure operations without requiring facial recognition or identifying individual customers.
How QSR Video Analytics Works
A useful QSR deployment has four stages:
- Capture: existing IP cameras or approved new cameras cover operational zones such as the entrance, order counter, kitchen pass, pickup area and drive-thru.
- Interpret: computer-vision models detect people, vehicles, movement, dwell time and defined process events.
- Measure: the platform converts those events into agreed metrics with a documented start point, end point and exception rule.
- Act: dashboards and alerts route a specific issue to the manager who can respond—for example, opening another counter when queue time crosses a threshold.
The model is only one part of the system. Camera placement, metric definitions, validation and the manager’s response process determine whether the analytics are operationally useful.
QSR Video Analytics Metrics That Matter
Start with metrics that map to a decision. Each metric should have one documented formula and one accountable owner.
- Queue length: the number of customers waiting inside a defined queue zone.
- Wait time: service-start timestamp minus queue-arrival timestamp.
- Service time: order-completion timestamp minus order-placement timestamp.
- Stage time: time spent at a specific step, such as order, payment, preparation or pickup.
- Throughput: completed orders divided by the selected time interval.
- Abandonment rate: customers who leave the queue before service divided by customers who entered it.
- SOP compliance rate: compliant observed events divided by eligible observed events.
- Zone occupancy: the number of people or vehicles present in a defined area at a given time.
Do not compare stores until camera coverage, operating hours, event definitions and exclusions are consistent.
What QSR Teams Can Improve
Video analytics is most valuable when it connects a recurring operational problem to a measurable response. QSR teams can use it to:
- spot queues and service bottlenecks while a shift is still in progress;
- compare service stages instead of relying only on an end-to-end average;
- identify repeated SOP exceptions that need coaching or process redesign;
- align staffing to observed demand by daypart and zone (for many Indian QSR chains, the lunch and late-evening peaks);
- review suspected loss or safety incidents with a narrower evidence window; and
- measure whether a workflow change improved the intended metric.
These benefits are not automatic. A dashboard that does not trigger a defined operating action becomes another reporting screen rather than a management tool.
Where Video Analytics Fits in a QSR
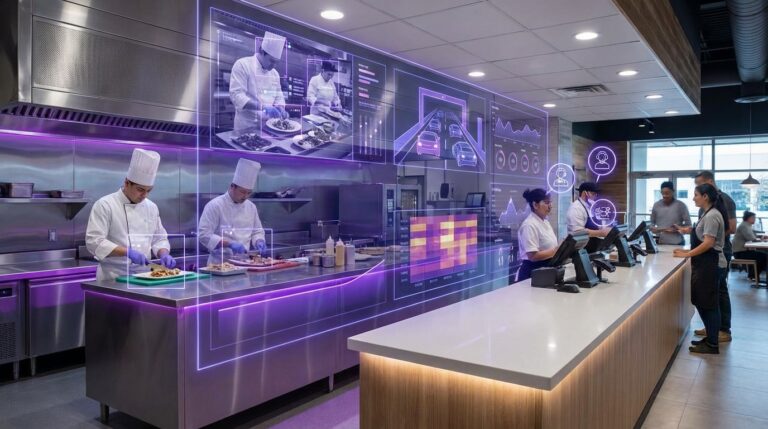
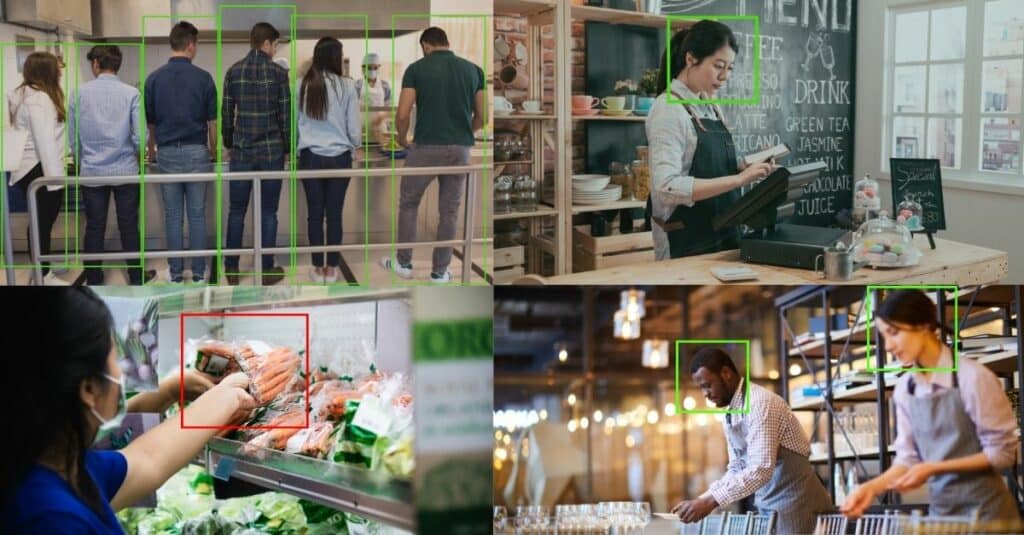
A QSR is a chain of connected service zones. At the entrance and counter, analytics can measure arrival, queue and wait. In the drive-thru, it can measure vehicle arrival, stage time and total service time. Around the kitchen pass and pickup area, it can measure order dwell and handoff congestion. Back-of-house views can support defined safety and SOP checks when camera position and policy permit.
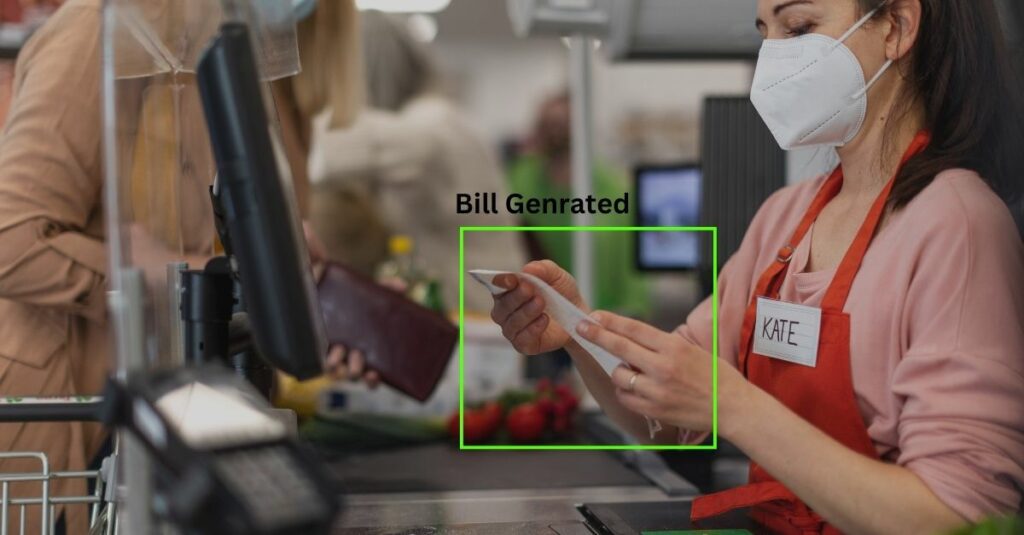
The aim is not to watch every movement. It is to instrument the few workflow stages that determine speed, consistency, safety or loss. Linking video events with POS or order-management timestamps can make those measurements more precise, provided the integration and data-governance rules are documented.
Core QSR Video Analytics Use Cases
The best first use case is a high-frequency problem with a clear metric, enough camera coverage and a manager who can act on the result. Four common starting points are below.
1. Queue and Wait-Time Analytics
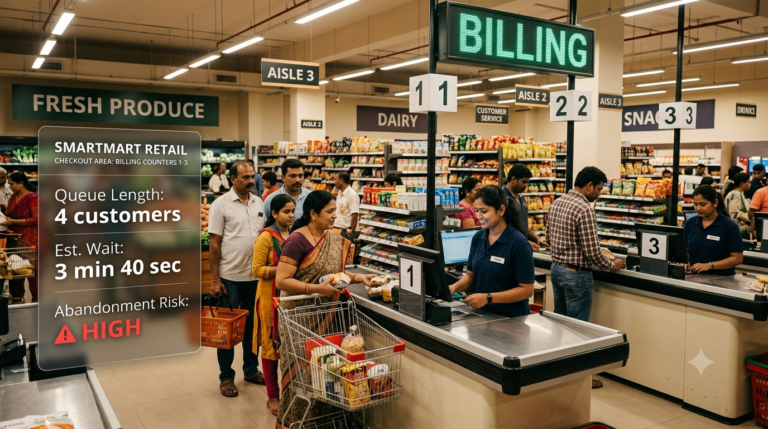
Queue analytics detects when a customer enters a defined waiting area, estimates queue length and measures time until service begins. Managers can use threshold alerts to open another counter, redirect staff or investigate why one daypart repeatedly misses the target. For example, a chain using Agrex AI’s QSR video analytics software might set an alert at 7 customers or 9 minutes in the queue zone so the shift manager can open a second counter before abandonment starts. Validate the metric against manual observations before using it for store comparisons.
2. Drive-Thru and Service-Time Analytics
Drive-thru analytics tracks vehicle events across stages such as arrival, order, payment and pickup. Stage-level timing shows whether delay is concentrated at ordering, production, payment or handoff. The camera layout must cover the relevant zones consistently, and the start and end event for each metric should match the restaurant’s operational definition.
3. SOP, Food-Safety and Quality Compliance
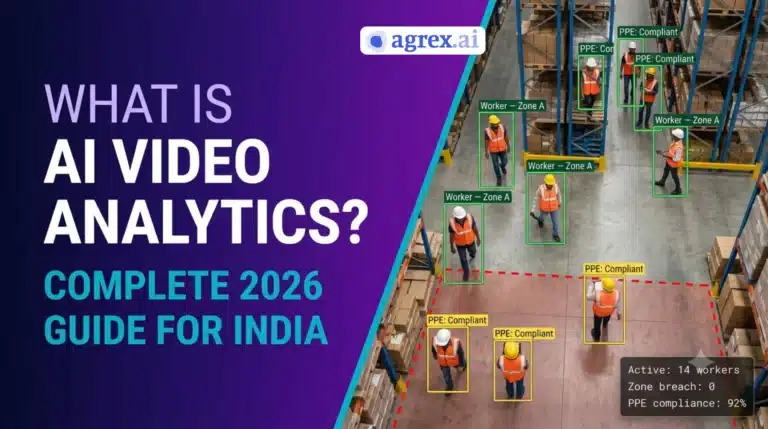
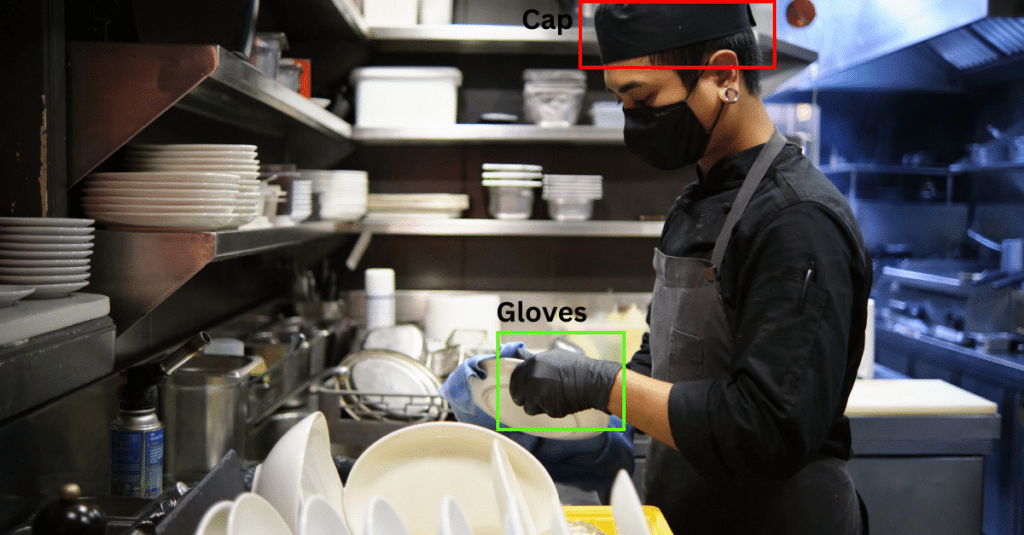
For visually observable procedures—such as the glove, hairnet and handwashing steps that Indian chains document for FSSAI Schedule 4 audits—video analytics can flag eligible events for review—for example, whether a required step occurred in the correct zone or sequence. It should not be presented as proof of compliance without human validation. Use the output to prioritize coaching and audits, document exceptions, and improve the process that produces recurring misses.
4. Loss Prevention and Incident Review
When video events are connected to approved POS or operational signals, teams can narrow the footage that needs review and investigate specific exceptions. Access should be role-based, retention should be limited to a documented purpose, and alerts should support human review rather than make an accusation or employment decision on their own.
What to Look for in a QSR Video Analytics Platform
Compare platforms on operational fit and evidence, not the number of AI features on a slide. Ask each vendor to define the metric, show the source event, explain expected error conditions and demonstrate how a restaurant manager receives and acts on an exception.
1. Metric Accuracy and Clear Definitions
Require written definitions for every reported metric, including the start event, end event, excluded cases and validation method. Test performance at your actual camera angles, lighting conditions, uniforms, layouts and peak traffic—not only on a vendor demonstration clip.
2. Existing-Camera and POS Integration
Confirm which camera standards, video-management systems and POS or order systems are supported. Ask whether integration is read-only, how timestamps are synchronized, what happens during connectivity loss and which data remains available if an integration changes.
3. Edge, Cloud and Data-Retention Controls
Understand where video is processed, what footage or metadata leaves the site, how long each type is retained and who can access it. Edge processing can reduce bandwidth and centralize only operational events, while cloud processing can simplify multi-site management. The right model depends on infrastructure, security policy and the use case.
4. Actionable Alerts and Reporting
An alert should identify the location, metric, threshold, time and expected action. Look for daypart and store comparisons, audit trails, configurable thresholds and a way to measure whether managers acknowledged or resolved an exception. More notifications are not better if teams cannot act on them.
How to Implement QSR Video Analytics
- Choose one workflow: start with a recurring operational problem, not a platform-wide rollout.
- Define the metric: write the formula, threshold, exclusions and accountable owner before configuring a model.
- Check coverage: confirm that the relevant event is visible across representative stores and dayparts.
- Establish a baseline: collect a stable pre-pilot period and record other process changes that could affect the result.
- Pilot and validate: compare model output with manual observations, including known difficult conditions.
- Connect insight to action: define who receives an alert, what they do and when the issue is escalated.
- Scale carefully: expand only after the metric, workflow and governance controls work consistently.
Evaluate the pilot against the selected operational metric and response process. Avoid claiming ROI from a short period unless costs, benefits, baseline and calculation method are all documented.

Limitations, Privacy and Responsible Use
Video analytics is a measurement aid, not ground truth. Occlusion, glare, camera movement, unusual layouts and changing operating conditions can affect results. Responsible deployments limit the analysis to a documented operational purpose, give people access only when their role requires it, and retain data only as long as that purpose requires.
1. Accuracy Depends on Camera and Site Conditions
Model accuracy can vary by store, zone and daypart. Build a representative validation set, review false positives and false negatives, and re-check performance after camera moves, layout changes or major seasonal shifts. Report uncertainty instead of treating every automated event as equally reliable.
2. Prefer Aggregated Operational Analytics
Many QSR use cases can be solved with anonymous counts, dwell times, paths and workflow events. Avoid biometric identification when an aggregated metric will answer the operating question. If a use case could identify a person or affect employment, obtain appropriate privacy, legal and human-resources review before deployment.
3. Define Retention, Access and Review Policies
Document what is stored, where it is processed, how long it is retained, who can export it and how access is audited. Establish a human-review path for contested or high-impact events. These controls should be part of vendor selection and pilot acceptance, not added after rollout.
Next Step: Choose the Metric Before the Model
QSR video analytics works when a restaurant defines one operational question, one measurable event and one action that a manager can take. Begin with a workflow such as queue delay, drive-thru stage time or a visually observable SOP. Validate the data, establish governance, and scale only when the result is repeatable.
For product capabilities and deployment options, see Agrex AI QSR video analytics software. For the current evidence example, review the QSR video analytics case study and assess its measurement basis alongside your own pilot design.
Frequently Asked Questions About QSR Video Analytics
How accurate is QSR video analytics?
Accuracy varies by store, camera angle, lighting and daypart. Validate model output against manual observations during a pilot, review false positives and false negatives, and re-check after camera moves or layout changes before using the metrics to compare stores.
Does QSR video analytics need facial recognition?
No. Most QSR use cases—queue length, wait time, service time, throughput and SOP checks—work with anonymous counts, dwell times and workflow events. Use identification only when a use case genuinely requires it, and only after privacy, legal and HR review.
Can QSR video analytics run on existing restaurant cameras?
Usually, yes. Existing IP cameras, and many analog systems through the NVR or DVR, can be used if they cover the operational zones consistently. Confirm supported camera standards, video-management systems and POS integrations with the vendor before the pilot.
How long does a QSR video analytics pilot take?
Connecting existing cameras can take days per location, but treat the pilot as complete only after it covers representative dayparts and a stable baseline. Judge it against the chosen operational metric and the manager response process, not a fixed calendar.