Last updated: May 2026
QUICK ANSWER
This 7-metric CFO framework gives finance and operations leaders a defensible ROI model for evaluating logistics video analytics in India — covering shrinkage recovery, PPE-hour reclamation, incident-cost reduction, loading-bay throughput, yard utilisation, audit-prep compression, and insurance-premium differentials. Most Indian multi-warehouse deployments reach payback inside two quarters.

2 Quarters
Typical CFO payback window on a 4-site rollout
62%
Verified cost reduction at a named Indian 3PL
<30 Days
Go-live on existing warehouse CCTV — no rip-and-replace
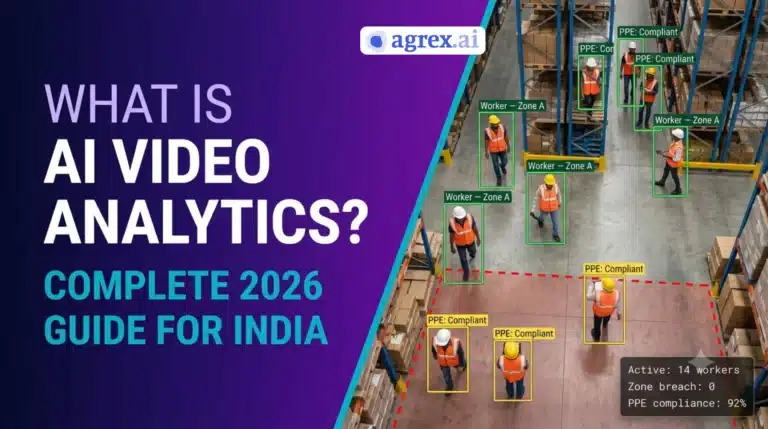
The short version: Logistics video analytics in India turns a static warehouse CCTV estate into a CFO-defensible operating tool. Logistics video analytics moves shrinkage from a sunk-cost line to a recoverable one. Logistics video analytics turns customer audit prep from a three-day scramble into a 90-minute export. The seven ROI metrics below are how finance leaders evaluate logistics video analytics in India in 2026 — and the framework separates a logistics video analytics platform built for Indian warehouses from one marketed at them. A serious logistics video analytics evaluation starts with measurable Year-0 baselines. The remainder of this guide is the logistics video analytics playbook that finance committees actually defend.
TABLE OF CONTENTS
- Why logistics CFOs need a different ROI lens in 2026
- The 7-metric CFO framework for logistics video analytics ROI
- Sample CFO calculation: a mid-sized 4-warehouse 3PL
- Case study: 62% cost reduction at a multi-warehouse 3PL
- From passive surveillance to autonomous logistics intelligence
- Red flags: when the ROI math doesn’t hold
- Cross-vertical ROI: how logistics compares to retail and QSR
- Frequently asked questions
Logistics video analytics India in 2026 is no longer a sunk-cost CCTV line — it is a measurable P&L lever. The logistics CFOs who unlock the highest ROI on logistics video analytics India are not the ones approving the biggest capex budgets. They are the ones who walk into the review with a defensible per-metric ROI model — and know which line items in the warehouse P&L the system actually moves.
The economics have changed. Tier-1 e-commerce clients no longer accept a 3PL’s word that their dock cages were locked at 2 AM, or that PPE compliance ran above 90% during the festive surge. They want timestamped evidence, by zone, by shift, exportable inside 24 hours. The 3PL that produces that data renews the contract. The one that cannot produce it loses allocation at the next quarterly business review — often without ever seeing a formal CAPA.
This playbook gives finance and operations leaders a 7-metric ROI framework for evaluating ai video analytics india investments across multi-warehouse logistics estates. Use it to score any platform on the line items your CFO actually defends in a budget meeting — and compress a six-week vendor selection into a single afternoon.
Already modeling the ROI?
Book a 30-minute CFO-fit walkthrough → — not a generic demo, but a session built around your warehouse footprint, existing NVR estate, and customer audit calendar.
Why Logistics CFOs Need a Different ROI Lens in 2026
For most of the last decade, video surveillance in Indian logistics was a sunk cost. Cameras went into docks, gates, and racking aisles to satisfy three audiences: the insurer, the police, and the customer’s quarterly walk-through. The footage existed to be pulled when something went wrong. Nobody built a P&L line around it.
Two structural shifts have ended that era.
First, customer audit pressure now extends down the 3PL supply chain. Tier-1 e-commerce platforms, FMCG majors, and pharmaceutical principals have systematised supplier audits with contractual enforcement. A failed audit at a logistics partner no longer generates a cosmetic warning — it generates a contractual remediation timeline, a reduced allocation at the next quarter, or a complete supplier requalification. The financial exposure of a single failed customer audit at a mid-sized 3PL now routinely exceeds the annual platform cost of a continuous monitoring system. CFOs who have absorbed one of these losses do not need a second one to understand the math.
Second, warehouse insurance underwriting has tightened. Industrial insurance renewals in 2025–26 are increasingly weighted on EHS evidence — not policy documents, but operational logs that demonstrate continuous compliance monitoring. Warehouses that can produce that evidence are seeing better risk classification. Those that cannot are absorbing higher premiums and, in some cases, lower coverage ceilings on third-party liability.
KEY INSIGHT
The CFO question has shifted from “how much does this video AI platform cost?” to “what does it cost us to keep running blind?” A single contract reallocation from a Tier-1 customer typically exceeds a 4-warehouse platform deployment cost by 3–5x. The ROI conversation that anchors on platform price is anchored on the wrong number.
Any ai video analytics platform india evaluation that skips the audit-evidence question is evaluating the wrong problem. The 7-metric framework below gives a CFO the line items to defend — not just the architecture criteria an IT manager would score.
The 7-Metric CFO Framework for Logistics Video Analytics India ROI
Score each metric against your current operational baseline. The framework deliberately separates direct cost savings (lines 1–4) from risk-cost reduction (lines 5–7) so the model survives a finance committee that distinguishes hard savings from soft savings.
1. Shrinkage Recovery Rate: The Dock-to-Rack Loss Line
Shrinkage in Indian warehouses concentrates at four touchpoints: receiving docks, picking aisles during peak shifts, packing stations, and outbound staging. A representative mid-sized 3PL absorbing 0.3–0.6% shrinkage on annualised throughput is sitting on a six-to-eight-figure annual leakage. Logistics video analytics applied to these four zones — combined with operator-level attribution — typically recovers 30–50% of that loss inside the first two quarters. The math is not about catching thieves; it is about creating an unavoidable audit chain that changes behaviour on day one. The same architecture is used in retail floors for loss prevention video analytics, applied to a different shrinkage profile.
What to ask operations:
Which four zones in our highest-throughput warehouse account for the majority of annual shrinkage loss? Do we have shift-attributable data, or only aggregate monthly numbers?
2. PPE Compliance Hours Reclaimed
The weekly cost of supervisor time spent on manual PPE walk-throughs, incident-report compilation, and footage review is invisible until you measure it. Across multi-shift warehouse operations, a single safety supervisor commonly spends 8–12 hours per week on compliance documentation that an autonomous system handles in real time. Across a 4-warehouse estate, that is a full-time equivalent freed for safety programme design rather than retroactive paperwork. The CFO line is direct: salary cost on documentation work, redirected to incident prevention work.
3. Incident Reduction Rate: The Workers’ Comp Line
Warehouse injury rates in India remain materially above OECD averages, and the financial tail of each incident — workers’ compensation, lost productivity, regulatory inspection, customer notification — compounds the visible cost. Continuous PPE and restricted-zone monitoring measurably reduces the leading indicators that drive these incidents. The published evidence base across Indian logistics deployments puts the incident-frequency reduction in the 35–60% range after the first compliance-monitoring quarter. The avoided cost per prevented incident is rarely below ₹1.5–3 lakhs all-in, and the multiplier across a multi-warehouse operation is material on its own.
4. Loading-Bay Throughput Lift
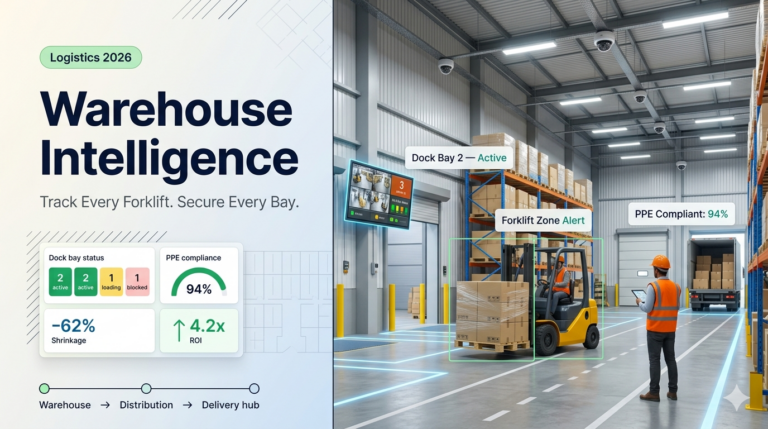
Truck dwell time at the dock is the single most expensive controllable variable in inbound and outbound operations. Detention costs, schedule cascades, and yard congestion all compound from a few minutes of avoidable dock idle. Logistics video analytics applied to dock zones — measuring trailer arrival, dock-door cycle time, loader assignment latency, and dwell — surfaces the bottlenecks that floor supervisors instinctively know but cannot quantify. Deployments that close the analytics loop with dock scheduling typically lift throughput 8–15% on the same headcount and same number of bays.
What to ask operations:
What is our current average truck dwell time at the inbound dock during peak shift? Do we have it by dock, by day-of-week, by carrier — or only as a monthly aggregate?
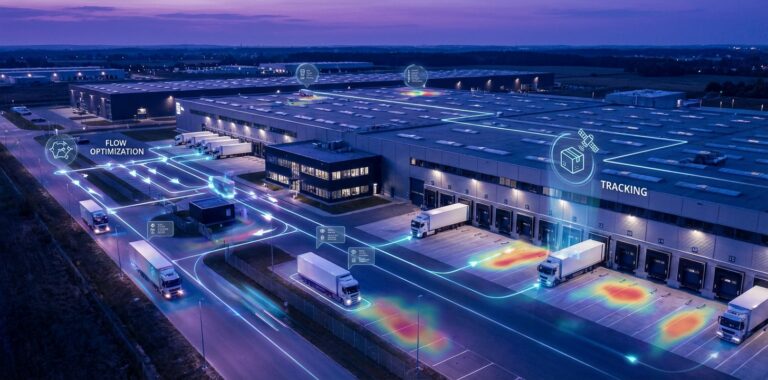
5. Yard Vehicle Utilisation and ANPR
Yard operations are the most under-instrumented line in a typical warehouse P&L. Trucks idle in the yard because nobody has a real-time view of which trailer is where, which is ready to dock, and which slot is open. Automatic Number Plate Recognition (ANPR) combined with yard-camera analytics turns the yard into a live ops console: trailer-to-bay matching, gate-to-dock cycle time, and unauthorised-vehicle alerts. The financial impact is split between direct detention savings, carrier-relationship value, and yard headcount efficiency.
6. Audit Preparation Time Compression
Before continuous monitoring, customer audits ran on a scramble: two to three days of supervisor time pulling DVR footage, compiling spreadsheets, and back-calculating compliance numbers that often did not exist as data in the first place. After deployment, the same audit becomes a 90-minute report export. For a 3PL servicing six to eight enterprise customers on quarterly or biannual audit cycles, this is the single most underestimated ROI line — and it is the one most CFOs miss in their initial business case because they do not see audit-prep hours on any cost centre.
7. Insurance Premium Differential
Industrial insurers underwriting Indian warehouse operations are increasingly differentiating premium quotes on operational evidence — not just declared SOPs. Warehouses with continuous compliance monitoring are starting to surface in the better risk tiers at renewal. The premium delta is rarely the headline ROI line, but for a CFO building a 5-year model it compounds materially, and it lowers the hurdle rate for the entire platform decision.
What to ask finance:
What did our 2025 warehouse insurance renewal cost, and what specific EHS data did the underwriter request? If we could produce continuous, timestamped compliance evidence by zone and shift, would we requalify into a better risk tier?
Sample CFO Calculation: A Mid-Sized 4-Warehouse 3PL
The model below is illustrative — built on publicly defensible assumptions for a representative 4-warehouse Indian 3PL doing ₹400–600 Cr in annualised throughput across automotive, FMCG, and e-commerce contracts. Numbers are presented as annualised first-year impact and should be re-fit to your own operating footprint.
| CFO ROI Line | Baseline Cost / Loss (₹/year) | Year-1 Impact |
|---|---|---|
| 1. Shrinkage recovery (4 sites) | 1.6–2.4 Cr | 40% recovered → ~80 L–1 Cr returned |
| 2. PPE compliance hours reclaimed | ~22 L (4 supervisors × 10 hrs/wk) | ~16–18 L redeployed to prevention |
| 3. Incident frequency reduction | ~35 L (claims + lost-time) | ~14–20 L avoided |
| 4. Loading-bay throughput lift | Detention + cascade ~60 L | 10% lift → ~6 L direct, larger indirect |
| 5. Yard utilisation / ANPR | Detention + headcount ~28 L | ~8–12 L direct savings |
| 6. Audit prep time compression | ~12 L supervisor-hours/year | ~9–10 L freed |
| 7. Insurance premium differential | Renewal baseline | 2–6% premium reduction at renewal |
| Indicative Year-1 ROI envelope | — | ₹1.35–1.75 Cr returned |
Against a typical 4-warehouse edge-AI platform deployment cost in the ₹50–80 L range (one-time plus first-year subscription), the payback window lands inside two quarters for most operating profiles. The 5-year NPV calculation is the easier case to defend; the harder discipline is honest baselining of the Year-0 numbers, because most warehouse operations have never measured these line items at the granularity the framework requires.
PRO TIP
Build the ROI model with two columns — “verified baseline” and “assumed baseline.” Force the operations team to label each line. The conversation that follows produces a more defensible model than any vendor’s pre-built calculator, because the gaps in your own data surface before procurement sees the slide.
FREE RESOURCE
Download the Editable 7-Metric CFO ROI Model
Google Sheet format. Pre-loaded with the seven ROI lines, baseline assumption columns, and a 5-year NPV calculation. Takes 20 minutes to complete with your operations team.
Case Study: 62% Cost Reduction at a Multi-Warehouse 3PL
A multi-warehouse logistics operator deploying Agrex AI’s AIVIS platform across its Indian estate reported a 62% reduction in operating cost lines tied to shrinkage, manual compliance documentation, and audit preparation inside the first full year. The deployment is documented in detail in the logistics video analytics case study, which covers the pre-deployment baseline, the rollout sequence across sites, and the per-line cost impact.
The deployment pattern is the one that recurs across Indian 3PLs evaluating video analytics services in india: existing warehouse CCTV connected over RTSP to an on-site edge box, phased go-live from security to compliance to operations, multi-site rollout from a templated Plant-1 architecture, and central ops oversight from a single console. No NVR replacement, no VLAN reconfiguration, no greenfield capex line.
From a Passive Video Monitoring System to an Autonomous Logistics Platform
A passive video monitoring system records what happened. An autonomous logistics platform acts on what is happening. The operational gap between those two sentences is measured in hours of incident lag and weeks of audit-preparation time — and translates directly into the CFO ROI lines above.
In a passive setup, the workflow is linear and retrospective: event occurs → footage is recorded → someone reviews it later → an incident report is filed, if anyone gets to it. The system is a storage medium. Every unit of intelligence in that loop is human, and every human in that loop has three other things to do. Detection-to-action lag in a passive warehouse environment is typically measured in hours on a good day and days when the shift supervisor is buried in the dock schedule.
In an autonomous platform, the loop is closed by the system: event occurs → AI classifies it in under a second → alert routes to the designated responder by violation type, zone, and shift schedule → responder acknowledges → system logs the full chain with timestamps → unacknowledged alerts escalate automatically. No human has to be watching a screen. The accountability chain runs without a supervisor in the room.
For Indian logistics, this shift is most consequential in three contexts: live PPE compliance on the floor before an incident occurs, restricted-zone intrusion at high-value cages or cold-chain rooms, and closed-loop audit evidence ready for a customer’s quarterly review without a scramble. The same architecture pattern applies in adjacent verticals — see how retail video analytics india deployments use the autonomous loop for shrinkage and conversion analytics, and how qsr video analytics applies it to queue management and SOP compliance.
Red Flags: When the ROI Math Doesn’t Hold
An ROI model that does not hold is usually broken at one of five points. CFOs reviewing a logistics video analytics business case should test for each before signing.
1. The vendor cannot quantify Year-0 baselines. If the platform pitch leads with target outcomes (“reduce shrinkage by 50%”) without forcing your team to baseline the current loss line first, the ROI math is being built on the vendor’s wishlist, not your operations data. A serious evaluation starts by measuring what you have, even if the answer is “we don’t actually know.”
2. The architecture requires capex you didn’t plan for. Any proposal that opens with “Step 1: upgrade your NVR” or “we need a new VLAN” is loading capex onto a project meant to return operating cost savings. Mature edge-AI platforms run on existing warehouse CCTV. If the proposal does not, the ROI window stretches by two quarters and the finance case weakens before pilot begins.
3. Custom-model timelines are quoted in quarters. Warehouse SOPs evolve. If your vendor needs 8–12 weeks to ship a custom detection model for a new use case, the logistics video analytics platform stops earning ROI the moment your operations change. Real platforms train and deploy custom agents in days, on your own camera footage as training data.
4. The audit-evidence layer is roadmapped, not shipped. If the vendor cannot open a live audit-evidence report — PPE compliance by zone and shift, exportable, timestamped — during the demo, the audit-prep ROI line evaporates. This is the most common gap among top video analytics companies in india that entered from a security-vendor background and grafted AI detection onto an existing VMS.
5. Named multi-warehouse references are unavailable. Every vendor in the ai video analytics companies market claims multi-site logistics deployments. The shortlist of vendors who can name them, provide direct reference contacts, and point to published case studies with measurable ROI is materially smaller. Anonymised references are not references — they are a pitch.
Cross-Vertical ROI: How Logistics Compares to Retail and QSR
Logistics video analytics ROI clusters around shrinkage, dock throughput, and audit evidence. The adjacent verticals have different anchor lines but the same underlying architecture pattern.
In retail, the equivalent CFO conversation is built on conversion lift, shelf-availability, and shrinkage at the store level — the underlying edge-AI architecture used in the warehouse, applied to a different floor plan and a different operator profile. In QSR, the ROI lines move into queue management, drive-thru cycle time, and SOP compliance at the prep station — the same closed-loop alerting model surfaced through a different operations dashboard. CFOs evaluating across portfolios of mixed-vertical real estate (logistics + retail, or logistics + light manufacturing) increasingly consolidate onto a single platform layer for one finance-controllable reason: per-site marginal cost falls as the platform footprint expands.
Frequently Asked Questions
What is logistics video analytics and how does it produce CFO-defensible ROI?
Logistics video analytics is the AI layer that turns warehouse CCTV into a measurable P&L tool — detecting shrinkage events, PPE violations, dock dwell, and yard movement, then routing alerts, escalating unacknowledged ones, and logging the chain as audit evidence. The CFO ROI is built across seven lines: shrinkage recovery, PPE-hour reclamation, incident reduction, dock throughput, yard utilisation, audit-prep compression, and insurance premium differential.
How long until a logistics video analytics platform pays back across multiple warehouses?
Most Indian multi-warehouse deployments reach payback inside two quarters. The single largest driver is avoided contract reallocation from a Tier-1 customer — one failed audit usually costs more than a 4-site platform deployment in full. Shrinkage recovery, supervisor-hour reclamation, and dock throughput lift compound on top of that across years one through three.
Do I have to replace my existing warehouse CCTV to deploy logistics video analytics?
No. A serious logistics video analytics platform is hardware-agnostic. Agrex.ai AIVIS connects to the IP cameras already in your warehouses via RTSP/ONVIF, integrates with legacy NVR/VMS, and adds an on-site edge AI box per site — no VLAN changes, no firewall rules, no cloud egress. Legacy analogue cameras on a DVR can be bridged with a low-cost encoder.
How does logistics video analytics actually quantify and recover warehouse shrinkage?
The system combines dock-zone activity timestamps, picker-aisle dwell anomalies, packing-station discrepancy flags, and operator-level identification across handoff points to build an unavoidable, timestamped audit chain. The deterrent effect changes behaviour on day one. Indian deployments typically recover 30–50% of annualised shrinkage loss inside the first two quarters at the four highest-loss zones.
What is the difference between a video monitoring system and an autonomous logistics platform?
A video monitoring system records footage for post-event review — every unit of intelligence in the loop is human. An autonomous logistics platform classifies events in under a second, routes alerts by violation type and shift, escalates if unacknowledged, and logs the full chain as audit-ready evidence. For a CFO, the first is a storage cost; the second is an operating asset that returns shrinkage, compliance, and audit-prep savings.
Is on-premise inference necessary for Indian 3PL warehouse data?
Not legally mandatory under current Indian data law, but operationally and contractually prudent. Warehouse footage exposes customer SKUs, packing patterns, and contract-specific handling protocols that most enterprise MSAs classify as confidential. Edge-AI deployments keep raw video on-premise; only processed metadata syncs to a central dashboard. The right legal question is what your customer’s NDA says about third-party access to operational data.
Which logistics video analytics platform is best for Indian 3PLs in 2026?
The right shortlist filter is the 7-metric CFO framework plus edge-AI architecture on existing CCTV, named multi-warehouse references, and a live audit-evidence layer demonstrable in the demo. Agrex.ai AIVIS is deployed in this pattern across Indian multi-warehouse 3PLs and is the platform behind the 62% cost-reduction case study referenced in this guide.
Choosing the Right Logistics Video Analytics Platform: The ROI Math Is the Decision
The 7-metric framework converts a logistics video analytics platform selection from a features tour into an ROI defence. Shrinkage, PPE-hour reclamation, incident reduction, throughput lift, yard utilisation, audit-prep compression, and insurance differential — these are the lines CFOs defend in a finance committee and the ones that separate an ai video analytics platform built for Indian logistics from one that was marketed at it.
Operations heads who walk into the review with a scored framework leave with a number, not a feeling. They run a shortlist meeting that ends in a pilot decision, not a follow-up committee. Use the framework above; build the baseline; defend the math.
NEXT STEP
Score Your Logistics ROI in 20 Minutes
Download the editable 7-metric CFO ROI model and book a 30-minute walkthrough built around your warehouse footprint. Bring the model to your next finance committee and leave with a decision, not a to-do list.
ABOUT THE AUTHOR
Dhruv Jearath
Digital Marketing Executive, Agrex AI
Dhruv Jearath leads digital marketing at Agrex AI, specialising in AI-powered video analytics for Indian manufacturing, retail, and logistics. He writes on edge AI deployment, customer audit-evidence design, and operations strategy for plant heads, CFOs, and supply-chain leaders across India.